Nimbus clouds in the sky tell us it will rain. When we hit the gym three times a week for months, we know we’re likely to build muscle mass.
These events that let us peek into the future are called leading indicators. They’re all around us, and ecommerce is no different. By tracking the right data, you can spot trends early, meet customer needs, and strengthen your position in the market. This guide helps you implement leading indicators for your business.
Table of contents:
- What is a leading indicator?
- What are the benefits of using leading indicator KPIs?
- How to determine leading indicators
- 4 examples of leading indicators for ecommerce
- Use leading indicators to maximize your ecommerce success
What is a leading indicator?
A leading indicator is a metric that can project the future performance of your business. In ecommerce, leading indicators may predict the success of your online store as a whole, as well as specific channels, like email marketing, social media campaigns, product guides, and influencer collaborations.
For example, the number of email subscribers, opens, and clicks can give you an idea of the number of sales you’ll get in the next week from a specific email campaign. (More about specific examples later.)
Do you need both leading and lagging indicators for your online store?
On the opposite end of leading indicators are lagging indicators—metrics that indicate your online store’s past performance.
These metrics are available to you after the fact—meaning the month, quarter, or year you’re reviewing is already finished, and your store has either hit or missed that period’s goals. A lagging indicator shows you whether a strategy you’ve executed brought desired results.
In the email campaign example above, lagging indicators are the number of sales and the average order value that email campaign generated.
Should you focus on leading or lagging indicators? The answer is: both.
Leading indicators forecast sales and other important metrics in real time, allowing you to course correct, while lagging indicators provide opportunities to learn from past strategies. With both, you have a complete picture of your business so you can prioritize the right activities at the right time.
What are the benefits of using leading indicator KPIs?
Leading indicator KPIs allow your ecommerce business to act without needing to wait for a campaign or a specific period to end before you know whether your efforts generated desired outcomes.
Here’s the breakdown of that benefit:
1. Faster feedback on current efforts and inputs compared to lagging metrics
Experimenting with a new strategy? Fulfillment partner? Customer service tool? Thanks to leading indicators, you can learn how well it’s doing sooner.
For example, if you’ve decided to update the formula you use to write subject lines for back-in-stock emails, you can track the impact of that change in real time through open rates and click-through rates—rather than waiting for the month to be over to review the total number of sales.
2. The chance to tweak your strategy and actions ahead of time
That new subject line formula isn’t giving you the email opens you’ve expected? Create another version of it and run A/B tests with those two different subject line options to see which one performs best.
An influencer’s social media post isn’t getting as much reach as predicted (leading metric), but it converts a high percentage of the people it does reach? Boost the reach of that campaign through paid social media ads.
The opportunity to adjust your path while you’re on it is a superpower.
3. Presents real-time company health
No matter the industry, employee motivation and engagement in organizations seems to jump through the roof when it’s time for acknowledgements and bonuses—think end of quarter or end of year.
Those rewards, of course, depend on lagging metrics like revenue, profit, and market share.
You can bring leading metrics to regular check-ins with team members so they can see the impact of their work. It has the possibility of keeping the company on the same page, and is a way to keep investors and other stakeholders up to date about the state of your ecommerce organization.
How to determine leading indicators
You can use specific leading indicators for short-term goals and campaigns, or as consistent metrics you regularly review in your business regardless of the current season or focus of your online store.
The process of finding your leading indicators is the same in both cases:
- First, identify your goals and desired outcomes (these are your lagging indicators)
- Then, work backward to identify the preceding metrics (these are your leading indicators)
Your lagging indicator shows an area to focus your effort and test different strategies and tactics. For leading indicators, you’re looking for metrics that signal the progress toward your business’s intended outcome.
Let’s say your goal is to increase email-generated revenue by 10% in six months.
For the first step, as you identify your goals and desired outcomes, compare revenue attributed to email marketing today to what it will be in six months. That’s a lagging metric that shows you whether you’ve hit the goal you’ve set.
For the second step, work backward to identify preceding metrics. List your real-time email metrics, like:
- Open rates
- Click-through rates
- Conversion rates from email
- Your subscriber count
- The number of emails you’re sending across different campaigns
Remember—lagging indicators measure your results once all the work has been done. With leading indicators, you can see what it takes to hit specific goals.
If, for example, you know that around 10% of your email recipients end up making a purchase from a specific type of email, you can estimate the number of subscribers you need on your list to hit your revenue goal months down the line.
4 examples of leading indicators for ecommerce
Want some examples of leading indicators you can try out in your own ecommerce business? Check out these four:
Example #1: Gift guide page views
- Goal: increase sales of products in a particular category
- Lagging indicator: number of product sales, revenue from a product category
- Leading indicator: page views on a gift shopping guide on the company’s blog
Gift guides are an excellent way to drive attention toward specific products in your merchandise mix. They are a particularly powerful asset during periods like holidays and Black Friday weekend, but they can convert at any point during the year.
Track the relationship between page views on your gift guide and the sales numbers for products included in it. That way, you can put extra efforts to promote the guide as needed—by engaging your affiliates to share it or building press coverage for it.
An example of a gift guide that can be used this way is the one from Three Ships, a natural beauty brand.
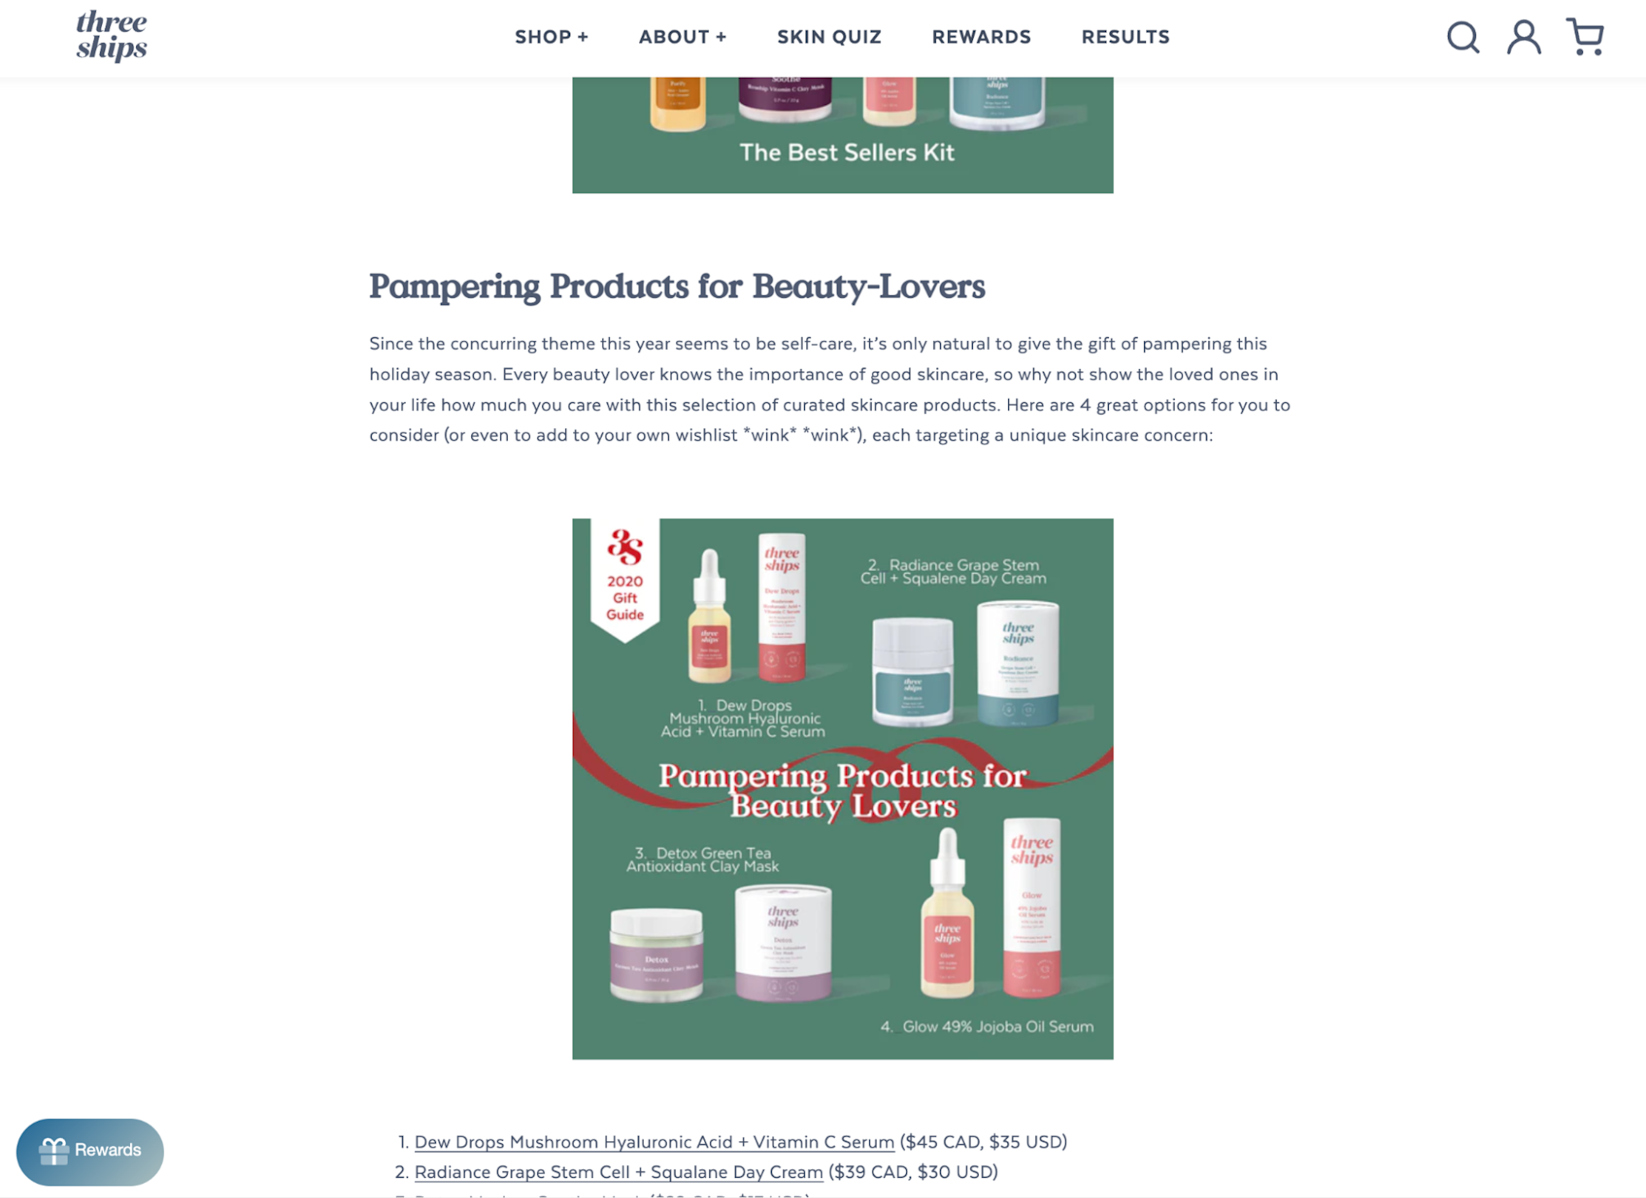
Three Ships blog pages that feature the brands gift kits.
Example #2: Time between purchases
- Goal: maintain customer retention rate
- Lagging indicator: number of customers who made a purchase at least once per month
- Leading indicator: time between two purchases
Winning a new customer feels great—but getting them to purchase from you again and again is remarkable.
It’s a sign that customers know they can trust and rely on your brand. That’s why the time between purchases is a powerful leading indicator. If someone makes an order every three weeks for a year, but then doesn’t make a single order in months, it’s a sign something might be off.
Of course, customers can simply change preferences. But if the reason they aren’t buying is that their favorite products are constantly out of stock, the cost of shipping increased, or your products no longer meet their standard—all of those are things you can do something about.
Diaspora, a spice brand, is an example of an ecommerce business that might lean on this metric, because it sells products customers need to replenish regularly.
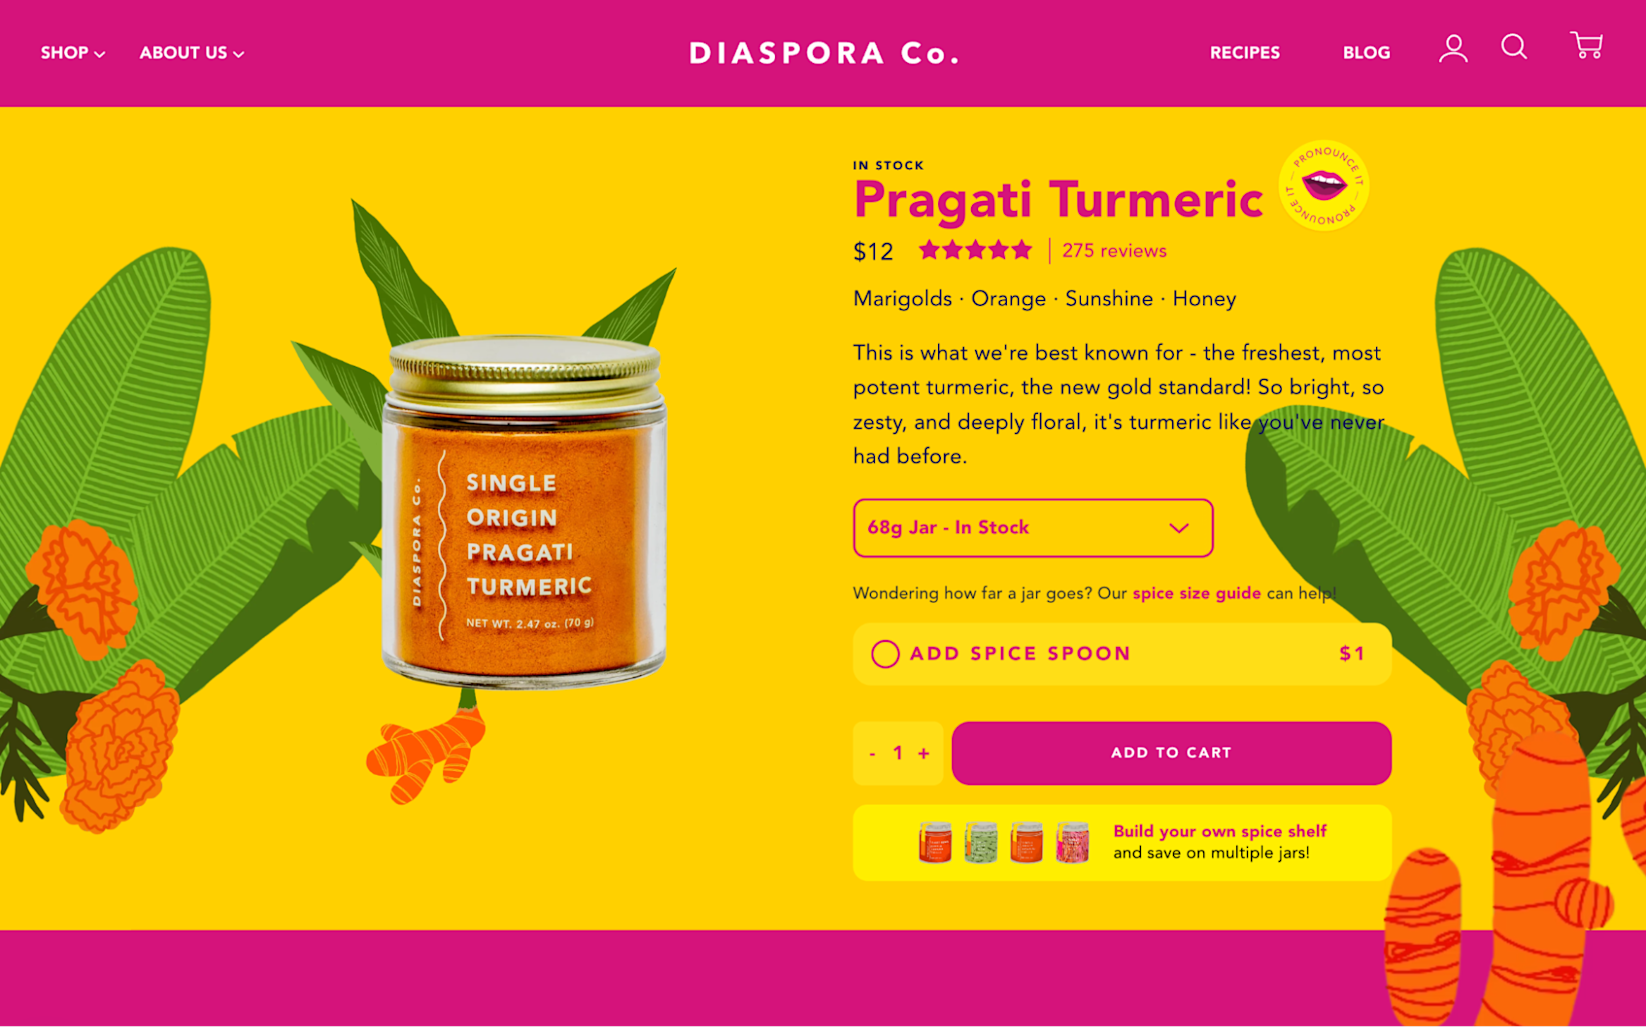
Diaspora product page with 68g jar on a colorful background, featuring Pragati Tumeric.
Example #3: Pop-up shop visitors and email signups
- Goal: attract new customers in a new geography
- Lagging indicator: number of new customers in a specific location
- Leading indicator: number of pop-up shop visitors, number of on-the-spot email signups
Expanding into a new country or region is a big task, not just because you have to figure out logistics like fulfillment and shipping, but because your brand might not be as known or trusted there.
That’s why pop-ups are a powerful expansion tactic. If you choose to implement it, you can track the number of people who visited your pop-up, along with the number of those who signed up for updates and those that made a purchase. With time, you can track how well you’ve turned subscribers into new customers, and new customers into repeat buyers.
As you repeat this process, these metrics become your indicators for future success in new markets based on the success of your pop-up.
A strong example of a company that might use this in real life is Allbirds, a sustainable shoe and clothing brand. Allbirds already has a retail presence, but Julie Channing, the company’s VP of marketing, says it relies on pop-ups to “learn how much appetite there is for Allbirds retail before fully committing to a city or neighborhood.”

Allbirds and Whalebone Magazine collaboration for an athletic shoe pop-up during the end-of-year holidays (Source).
Example #4: Customer service tickets and refund requests
- Goal: meet and exceed customer expectations
- Lagging indicator: customer satisfaction metrics like Net Promoter Score (NPS) and customer satisfaction score (CSAT)
- Leading indicator: number of customer service tickets, number of refund requests
Research shows that great customer experience (CX) drives repeat purchases, fuels customer loyalty, and increases customer lifetime value. Investing in customer experience—from the moment a person visits your website all the way through to receiving and unpacking an order—is worth it.
Using a leading indicator to track CX, as opposed to waiting to collect hundreds of customer scores on a survey, gives you an advantage: You can spot a potential issue quickly and solve it for other customers before they even run into it.
For example, a sudden jump in refund requests might mean consumer confidence in the product quality has dropped, or that your sizing charts on product pages are less accurate than before. A peak in customer service tickets can reveal errors or confusing parts of your checkout flow.
A company like Glowforge, an at-home 3D laser printer company, might implement this to catch an issue customers have with choosing the right material type, size, and thickness for their project. By being proactive, the company can increase customer satisfaction weeks and months down the line.
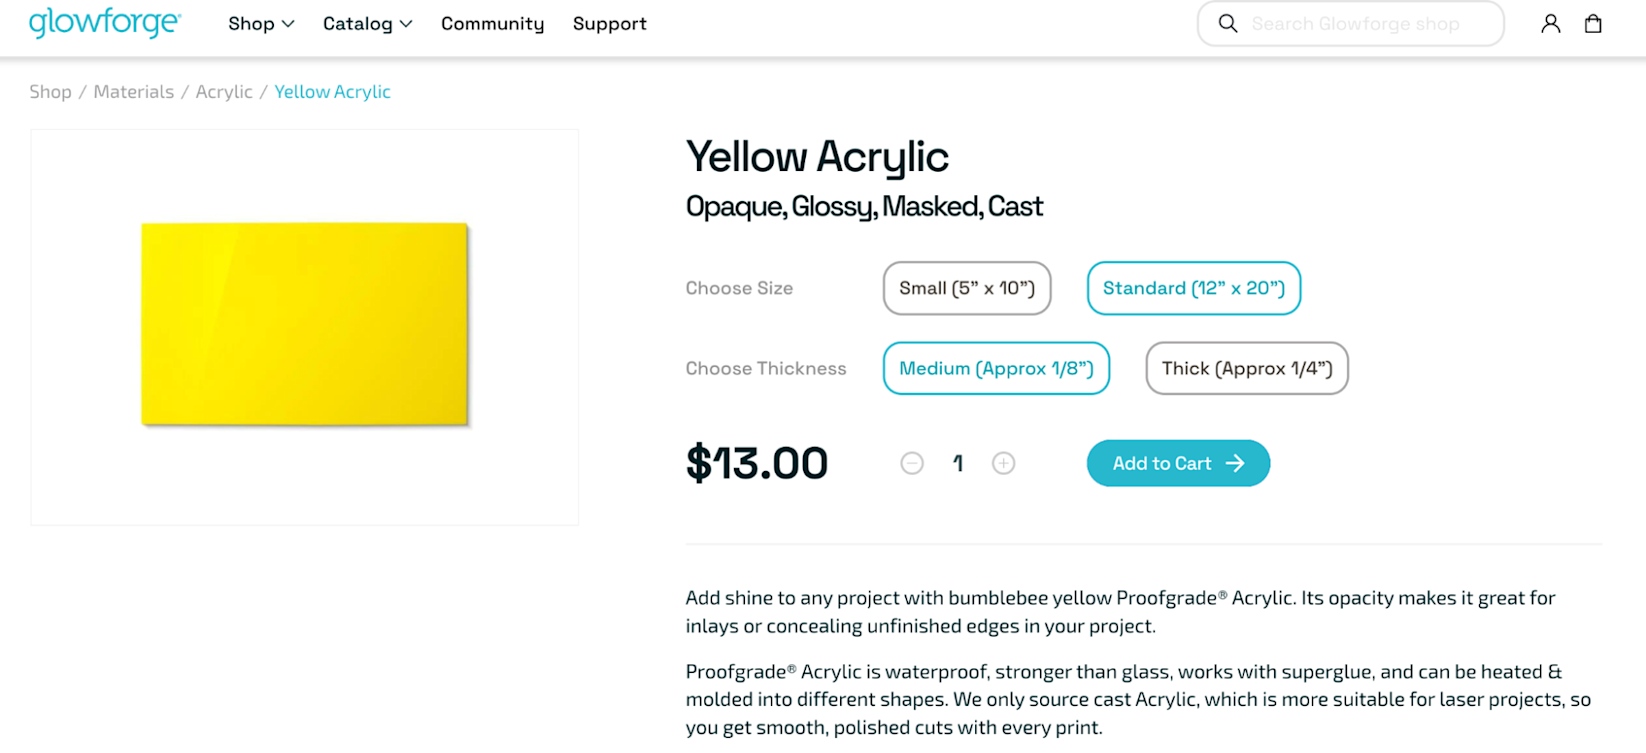
Glowforge website product page featuring Yellow Acrylic.
Use leading indicators to maximize your ecommerce success
Leading indicators are signals of future success. Find the right leading indicators—metrics and factors that affect outcomes like the number of sales, your revenue, and customer loyalty.
Start by uncovering what those factors are and experiment for the next quarter so you can reflect, optimize, and thrive.
Leading indicators FAQ
What are examples of leading indicators?
Some examples of leading indicators include email open rates and click-through rates (indicating future sales from email), time between purchases (indicating customer loyalty or churn), and refund requests (indicating a product issue).
What is the best leading indicator?
The best leading indicator for your business is the one that precedes your desired outcome. For example, if you want to hit a certain number of repeat customers, your best option is tracking data like time between purchases.
What are leading and lagging indicators?
Leading and lagging indicators represent two types of data for the same process—for example, a marketing campaign or ongoing customer support.
Leading indicators are forward-looking metrics, or those that project future performance based on what’s currently happening. Lagging indicators are metrics you’re able to review once a campaign is over or after a specified time period.
Read More
- SEO Product Descriptions: 7 Tips To Optimize Your Product Pages for Search
- Ecommerce Pricing Strategies: How to Scale and Grow Without Losing Profit
- Gift Wrapping in Ecommerce: How to Boost AOV This Holiday Season
- Ecommerce Customer Experience: Mastering Acquisition and Retention
- How Ecommerce Teams Get Buy-in To Sell More
- Overhauling Your Customer Acquisition Model: How to Spend Your Budget Where It Really Counts
- How to Monetize Dormant Customers With a Successful Winback Campaign
- How to Create a Brand People Can’t Forget: Purple Mattress on Product, Voice, and Culture
- How to Personalize for Unknown Black Friday Cyber Monday Mobile Visitors
- How to Optimize Your Mobile Checkout Flow