With another historic shopping weekend now in the books, it’s time to dissect the Black Friday Cyber Monday data, take a look at how Shopify merchants did during this massive sales event, and share what lessons we can carry forward to next year.
Before we do, however, it’s important to recognize that this wasn’t just another Black Friday Cyber Monday for Shopify merchants.
It was the biggest BFCM to date: Over $1 billion USD in sales were processed during the course of the 4-day event.
Just how big was BFCM 2017?

Throughout the weekend of Black Friday Cyber Monday, November 24th to 26th, Shopify merchants collectively generated over $1 billion in sales. That’s an impressive feat for only four days.
Let’s put that into perspective.
At the height of the weekend-long sales event, Shopify merchants were processing $1,138,574 per minute in sales compared to the $555,716 per minute peak in 2016.
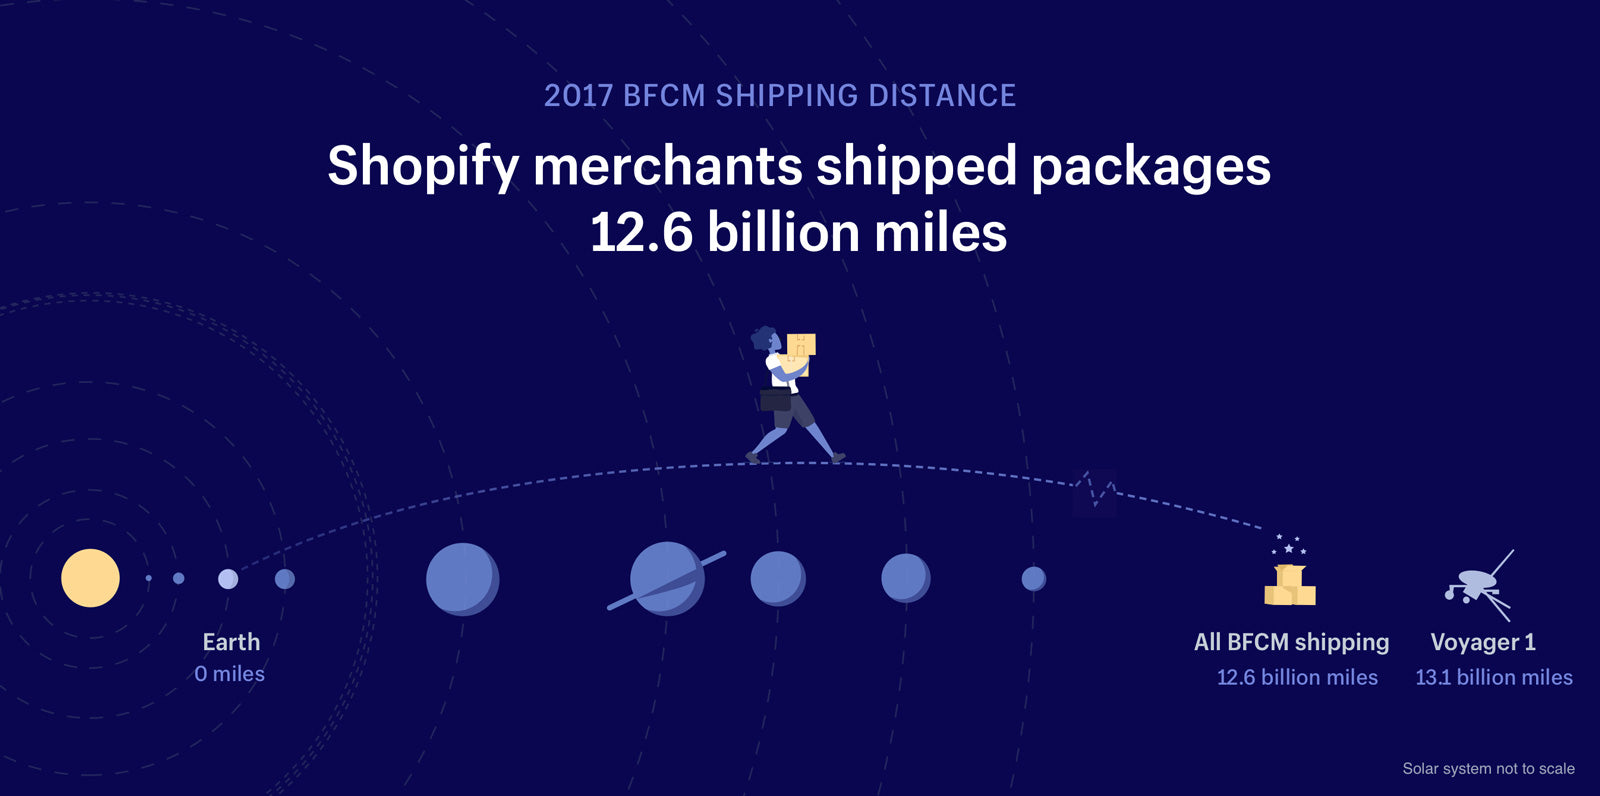
During the weekend, merchants shipped orders all over the world. Packages would travel a combined 12.6 billion miles to reach customers—more than twice the distance from Earth to Pluto.
That’s a lot of orders. And from this frenzy of purchases, some interesting trends have developed that provide us with a better understanding of one of the year’s largest shopping events.
The biggest trends of Black Friday Cyber Monday 2017
During this pivotal 4-day sales weekend, a few noteworthy patterns emerged regarding the way consumers shop during this time of year.
Here are 5 of the most interesting trends we surfaced from our Black Friday Cyber Monday data.
1. Mobile shopping overtook desktop
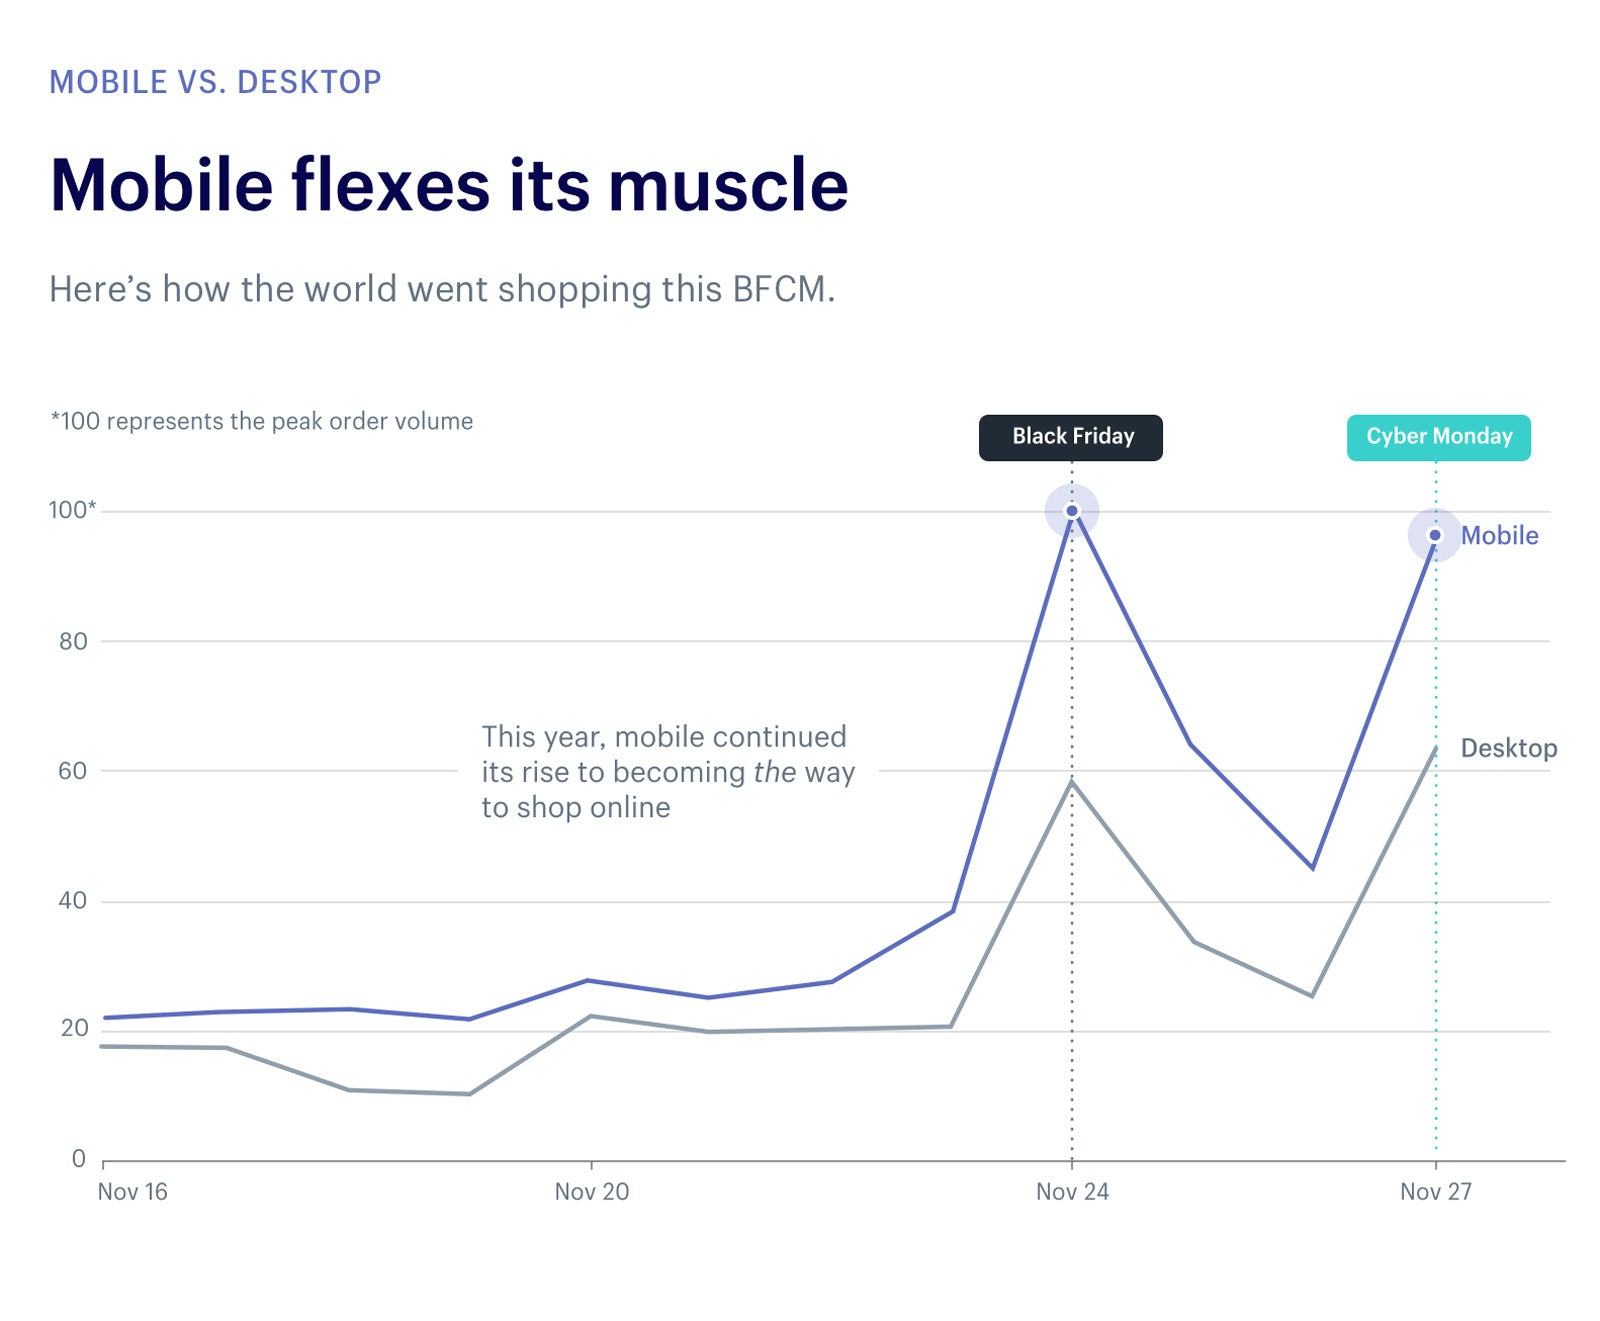
Mobile shopping has become an increasingly popular way for consumers to discover and buy products. Last year, mobile purchases surpassed desktop on Black Friday, but fell just short on Cyber Monday.
However, this year mobile purchases surpassed desktop throughout the entire weekend, perhaps due to improvements to the mobile shopping experience.
Mobile sales accounted for 64% of orders overall, an increase of 10% year-over-year.2. Cyber Monday is catching up to Black Friday
Cyber Monday is a much younger sales event than Black Friday. While Cyber Monday was only conceived in 2005, Black Friday goes as far back as 1959.
As such, more shoppers actually participated in Black Friday online last year despite Cyber Monday’s focus on ecommerce.
However, this year we saw Cyber Monday continue to close the gap with Black Friday in terms of order volume for merchants.
3. BFCM continues to grow globally
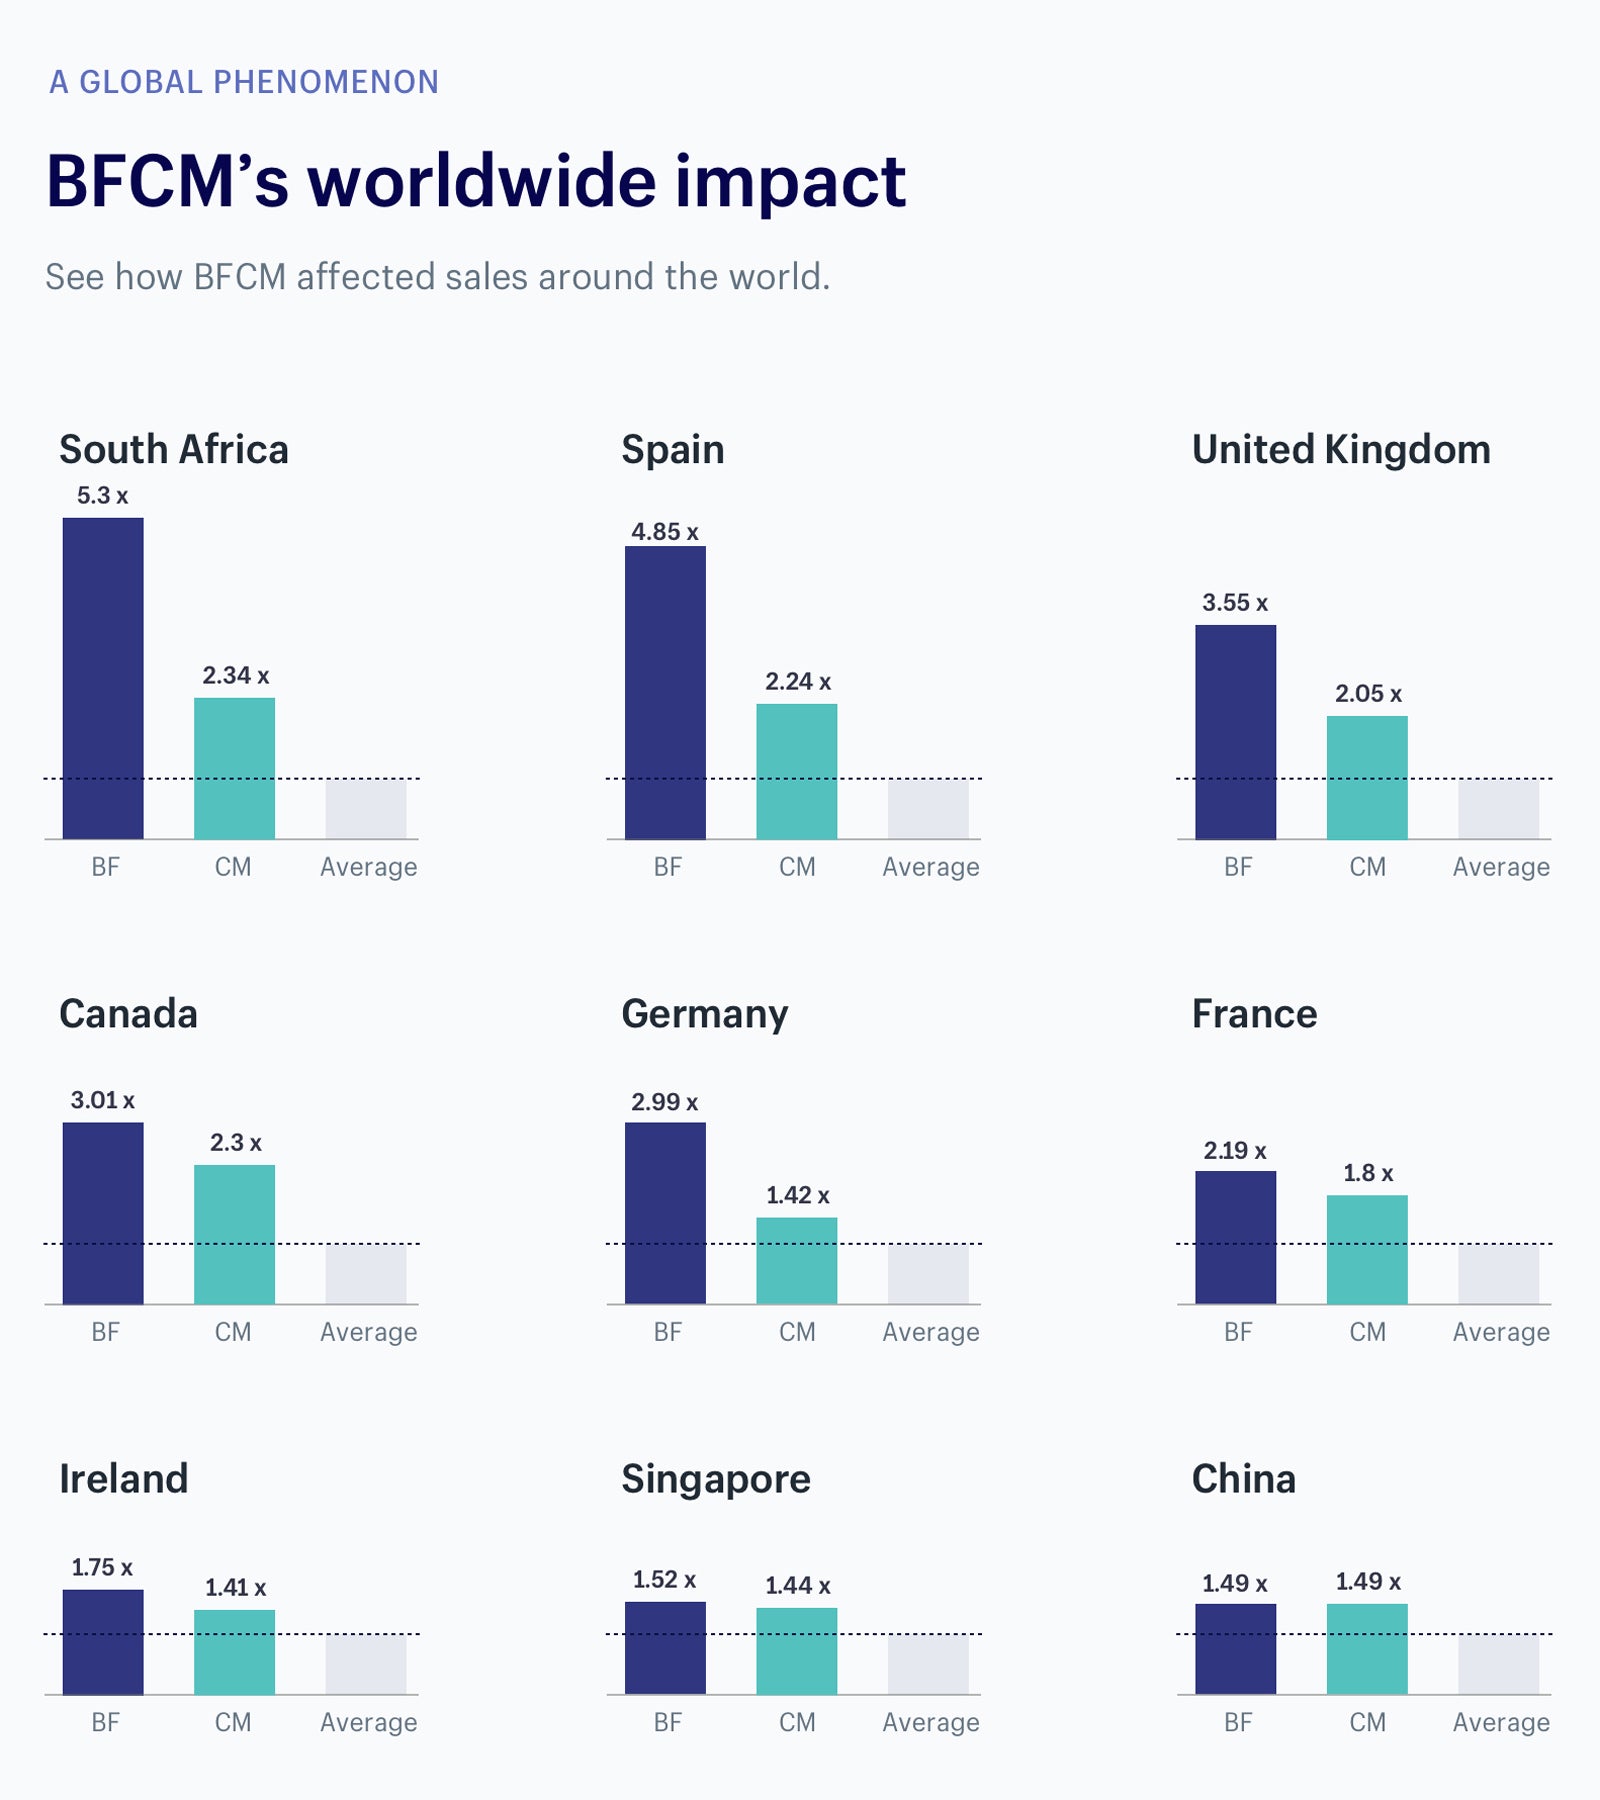
As with last year, we also saw significant growth in adoption of Black Friday beyond the borders of the United States.
Most notably, the UK, Spain and South Africa were countries that saw the biggest increase in sales compared to an average day in November.
South African businesses in particular saw over 5.3 times as many orders on Black Friday.4. Email had the highest conversion rate
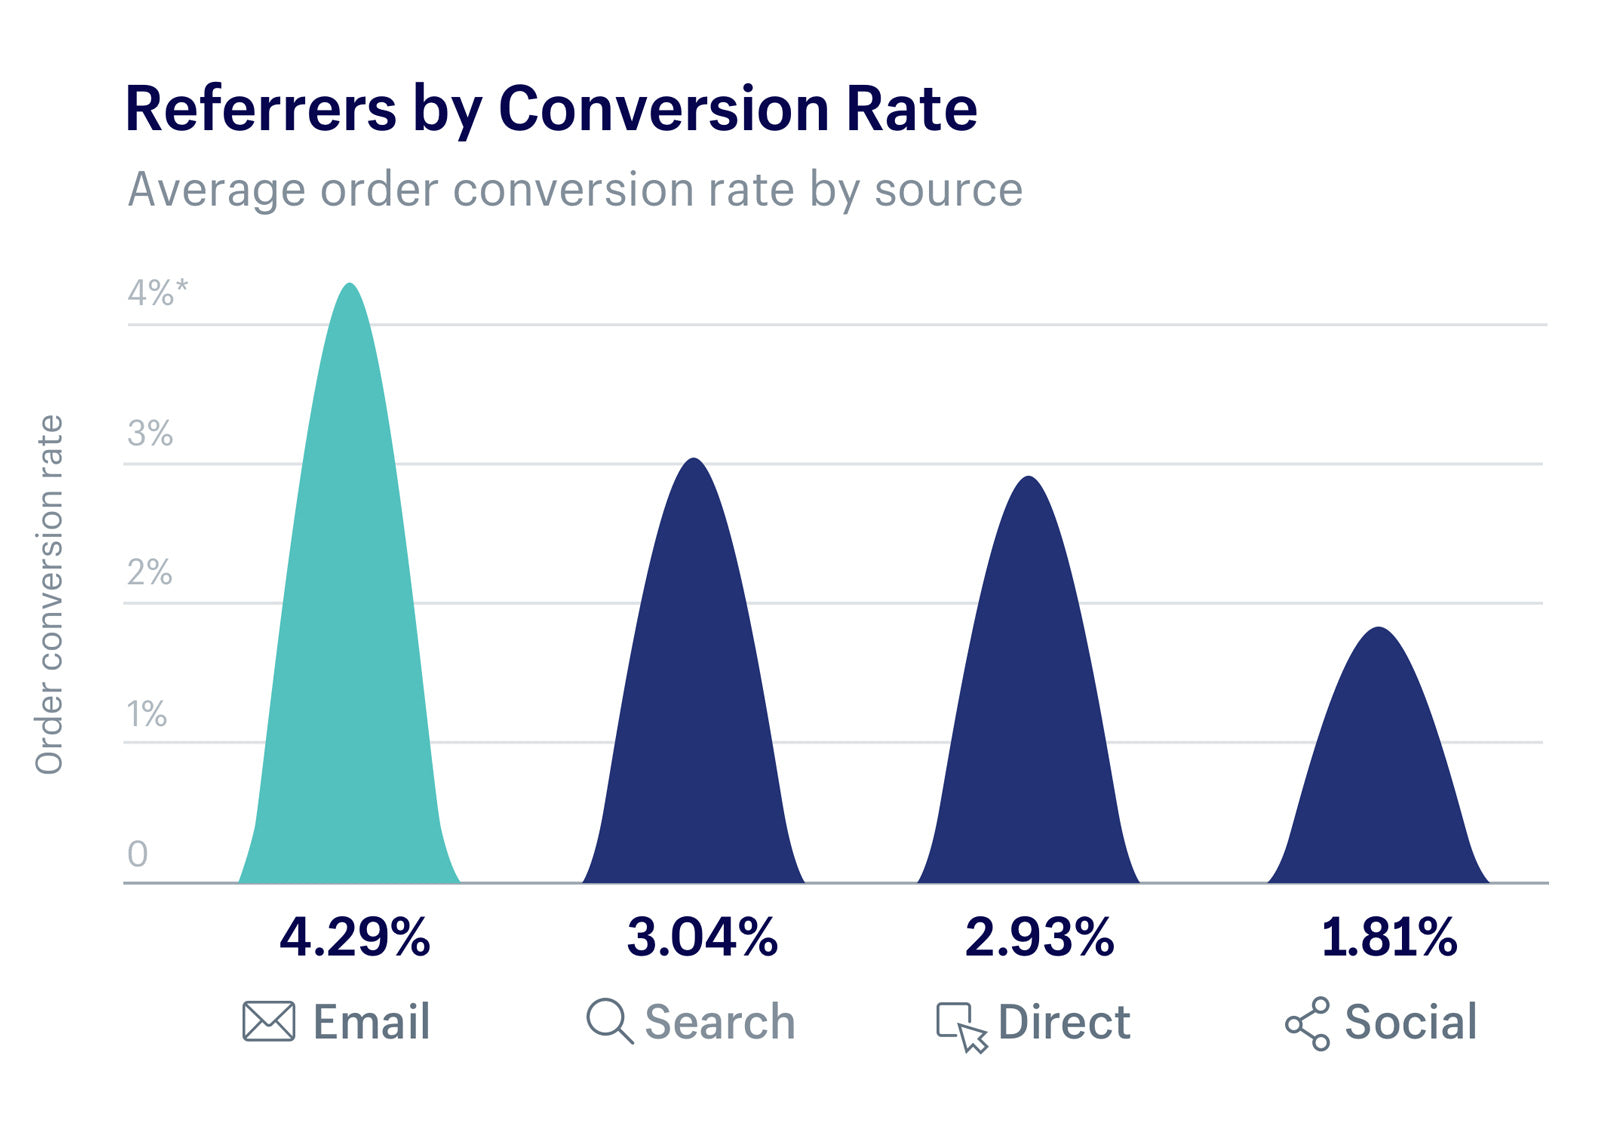
This year, we also looked at how different sources performed during Black Friday Cyber Monday.
While this doesn't mean that these channels were responsible for the most orders during BFCM, it does suggest that they are good sources to explore next year for qualified traffic.
5. The biggest buys this year were...
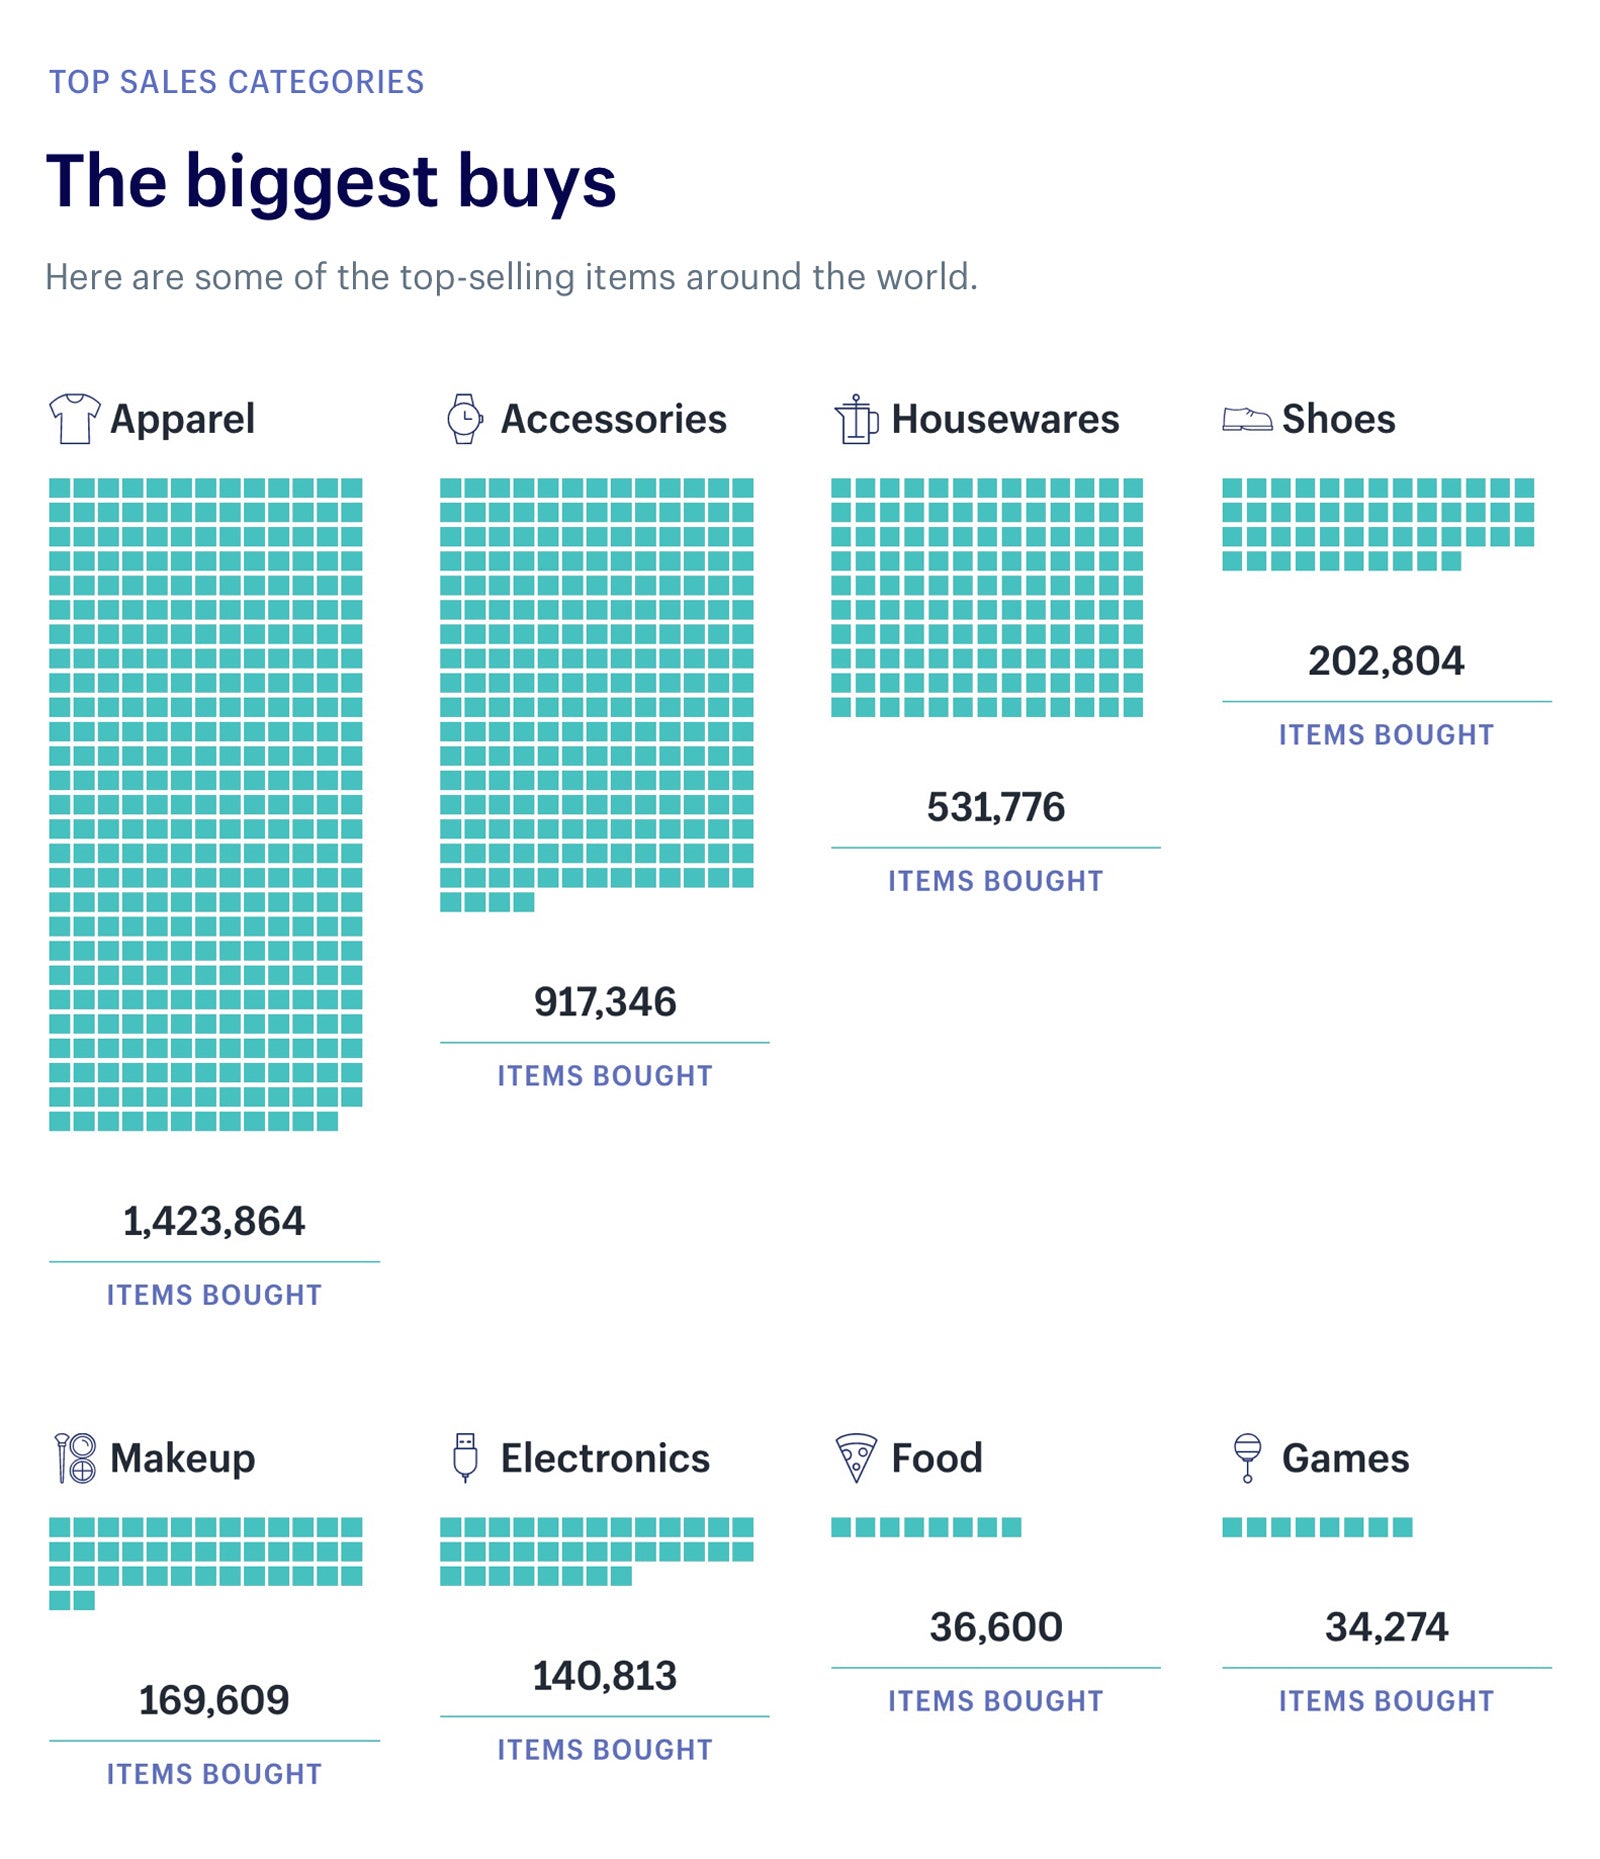
Different industries fare differently during Black Friday Cyber Monday.
This year, apparel led the pack with over 1.8 million items purchased, followed by accessories (watches, wallets, etc.) and housewares at around 917,300 and 531,700 respectively.
It seems Black Friday Cyber Monday was an especially big win for the fashion and apparel industry in 2017.
How was your BFCM?
Altogether, it was a decidedly successful year for many Shopify merchants with insights to inform your Black Friday Cyber Monday next year.
Now we want to hear about your experience. Did you notice a spike in sales? What marketing tactics were the most valuable to you?
Share your wins and lessons learned in the comments below!
*Shopify’s Black Friday/Cyber Monday data was based on sales experienced by its more than 500,000 businesses in 175 countries around the world from November 24 to November 27, 2017. All data presented here is approximate and is based on various assumptions. All data is unaudited and is subject to adjustment.
Read more
- Augmented Reality Brings a New Dimension of Engagement to the Customer Experience
- Here’s Everything We Announced at Unite, and What It Means for You As a Merchant
- How Ondo's Customers Using Shop Pay Installments Are Spending 2x More Than Regular Customers
- How Shopify Fulfillment Network Brings 2-Day Delivery to Your Store
- Shopify's Tap & Chip Card Reader Is Now Available in Canada—Accept Safe and Convenient Contactless Payments
- Shopify Unite is a Glimpse at the Future of Commerce
- Introducing Store Checkout On Your Own Business Domain
- Shopify Shipping Brings Calculated Rates to All Shopify Plans
- Shopify protect: Fraud sucks. Fight back.


