Shopify blog

Each day a retail store is open, it sees metrics like daily sales, foot traffic, average order value, and staff performance fluctuate. These numbers help a brand understand its overall store performance, creating a picture of how well a location is running and where it might need improvement.
Measuring and understanding your store’s performance helps you identify areas that need attention, so you can keep improving performance and drive more sales and foot traffic.
This guide covers what store performance means, why measuring it matters, which KPIs to track, and how to improve your results over time.
What is store performance?
Store performance measures a retail location’s success and profitability across sales, inventory, staff efficiency, and customer experience. To get a clear idea of your store’s performance, track a set of key performance indicators (KPI)s, including:
- Financial metrics. Daily sales, average order value (AOV), gross margin, and year-over-year growth.
- Efficiency metrics. Inventory turnover, sell-through rate, and sales per square foot.
- Customer-facing metrics. Foot traffic, conversion rate, and customer lifetime value (CLV).
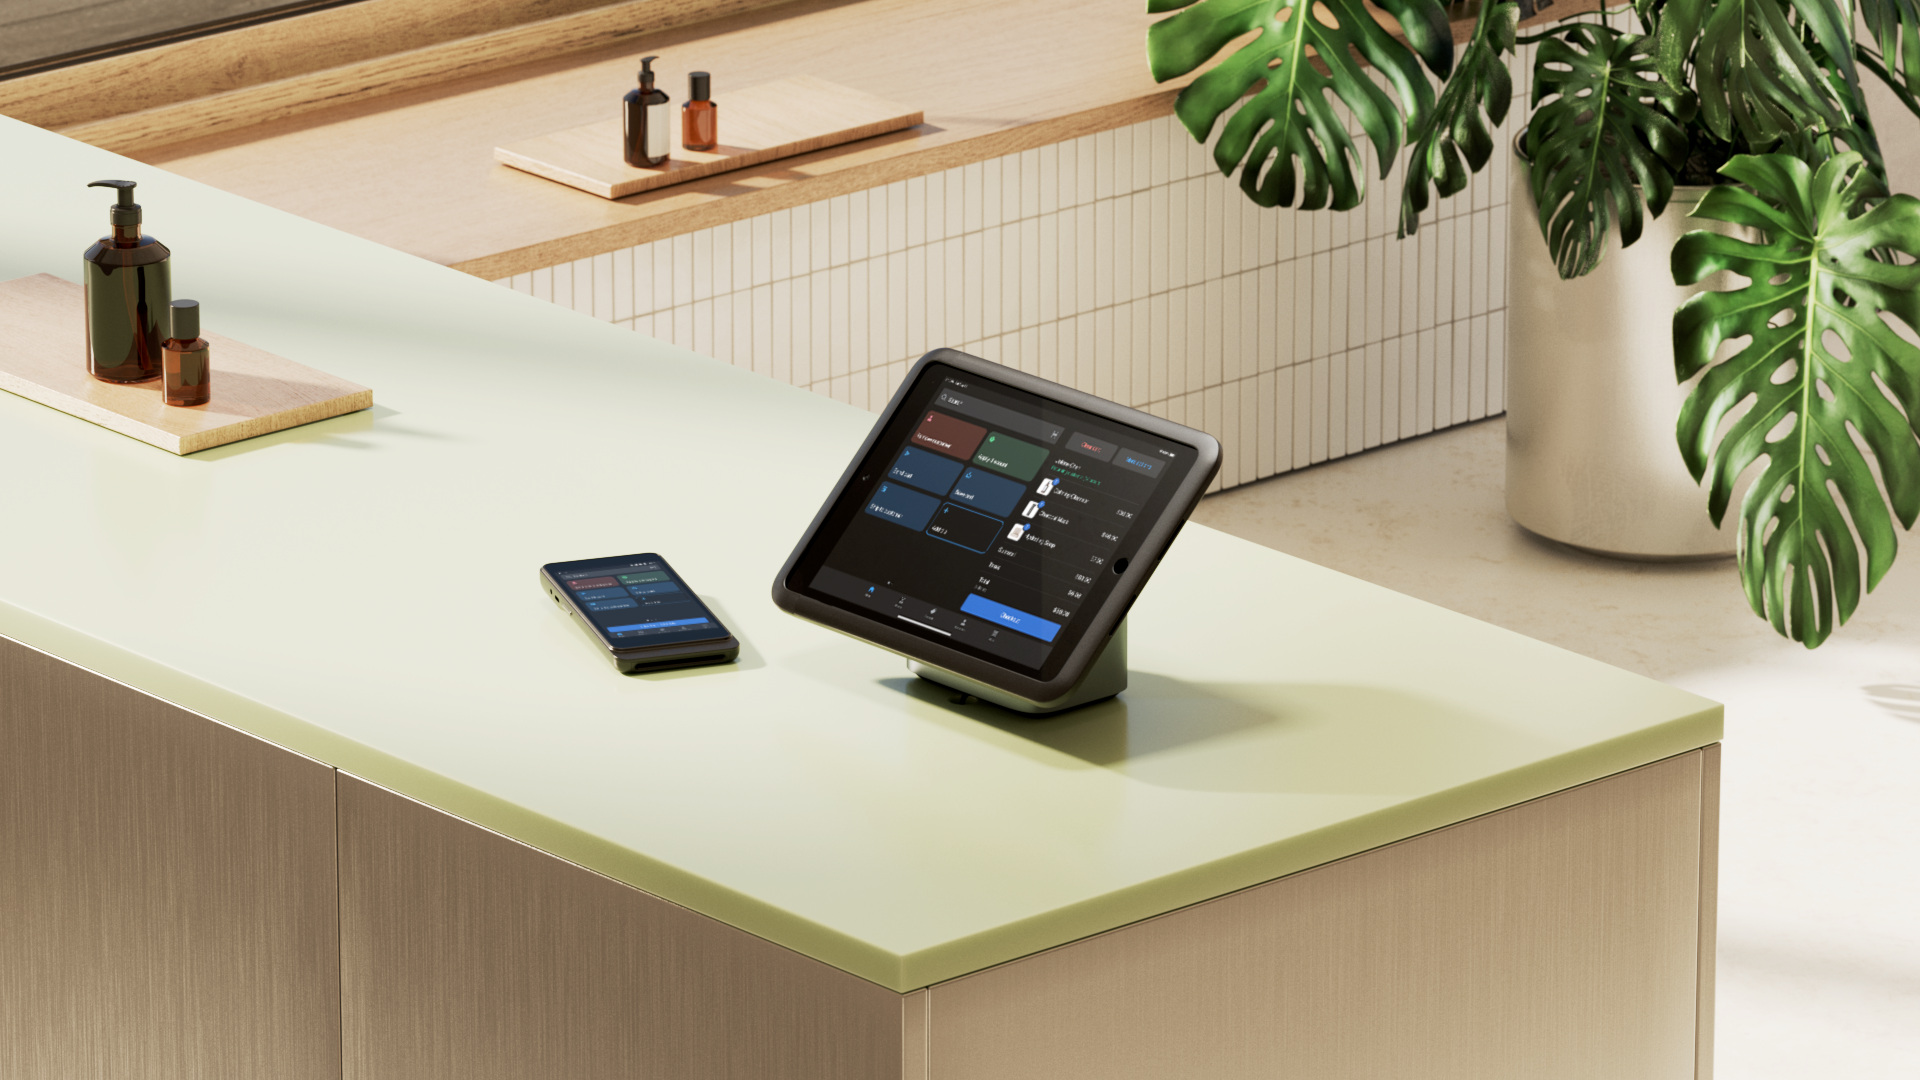
Use a store performance dashboard to bring these KPIs onto a single screen so you can review them all at a glance. In Shopify, the Shopify POS Analytics screen and the admin Point of Sale Overview is that dashboard for retailers, showing sales, order value, and staff performance without needing to switch between separate reports.
Importance of measuring store performance
Tracking store performance shows where your business needs attention before small issues become expensive ones. It also informs staffing and inventory decisions so you can benchmark results against your own history and industry norms.
Influencing business decisions
Store performance data “helps drive decision-making,” says Dr. Joseph Aversa, associate professor at Toronto Metropolitan University’s Ted Rogers School of Retail Management. “In a data-driven decision-making environment, it can help retailers understand what area of the business needs improvement, where to focus resources, or, from an operational standpoint, how many employees you need on a Saturday or during the holiday season.”
Identifying potential risks
Monitoring store performance “allows retailers to minimize the risk of making bad decisions, because they’re being informed by data that’s being collected within their spaces,” Joseph says.
“Tracking performance gives you so much power. Understanding how well your business is doing lets you quickly spot problems and fix them, saving you time and money. It also helps you avoid making the same costly mistakes in the future,” says Amanda Fleischer, visual merchandising consultant and founder of Shopspitality.
Yuvi Alpert, founder, creative director, and CEO of jewelry brand Noémie, agrees.
“Businesses that fail to analyze store performance miss why some of their parts may under- or over-perform, losing out on valuable data that can help them as a whole,” he says.
That kind of analysis, whether it’s applied to website traffic, units per conversion, or sales per employee, can reveal poor marketing or product messaging, training issues, or an opportunity to increase sales through techniques like bundling.
Improving forecasting
Store performance data feeds directly into forecasting. When you know your store’s key metrics, you can predict cash flow, inventory needs, and staffing needs ahead of time. Accurate forecasting also matters if you’re looking for investors, since it shows a clear grasp of your business’s future.
Establishing benchmarks
Data means nothing without context. “All these metrics give you benchmarks for comparison,” Joseph says.
“Knowing which numbers to look at is a good start, but if you don’t know what they mean, you won’t know how to respond. Responding to what the report card is telling you is the most important part,” Amanda says.
She offers a practical example of how to use your average order value.
“Whatever your daily AOV is, it must be compared to the weekly and monthly AOV to know if it’s growing, and to what you’ve been averaging over the past year,” she says. “That tells you exactly how much you need to increase sales by.”
It’s also a good idea to compare your growth to your industry’s overall growth to see how your store is performing relative to your competitors. Statista benchmarking data shows year-over-year growth in the following categories:
- Electronics and appliances: 11.59%
- Clothing and accessories: 10.25%
- Health and personal care: 8.87%
- Sporting goods, hobby, music, and bookstores: 8.59%
- General merchandise: 8.28%
- Digital products: 7.79%
- Food services and drinking places: 6.67%
- Miscellaneous: 6.18%
- Grocery and beverage: 6.01%
- Furniture and home furnishings: 3.35%
Consider context when you’re reviewing numbers, and remember that a single metric can’t tell the whole story. For instance, don’t react to a single day’s AOV without comparing it to your weekly, monthly, or annual average to get the full picture.
Retail store performance metrics to track
The fastest way to track performance numbers is with a store performance dashboard, a single interface that pulls your KPIs together so you don’t have to jump between reports.
In Shopify, the Shopify POS Analytics screen shows your Daily Sales report with KPIs like net sales, AOV, items per order, top products, and top staff. And the admin Point of Sale Overview gives you data like gross sales, orders, discounts, and refunds.
Resort wear brand Kenny Flowers uses custom Shopify reports to compare their Charleston flagship store with their other sales channels, monitor traffic patterns, and use the data to set staffing levels, set store hours, and make inventory decisions.
Check these metrics regularly to understand your store’s health.
Conversion rate
What it is: The percentage of store visitors who make a purchase.
How to find it: Divide the number of transactions by foot traffic (or visits) for the period, then multiply by 100.
How to use it: A low conversion rate against healthy foot traffic could mean a store layout, staffing, or merchandising issue worth investigating.
Average order value
What it is: Average order value tells you how much your customers are spending per order on average. It also indirectly measures how well leadership is keeping a sales team engaged, on track, and successful throughout the day.
“If your AOV is inconsistent, it can be a sign that leadership isn’t keeping everyone focused, or there isn’t enough accountability built into the workflow and store policies,” Shopspitality Founder Amanda says.
How to find it: Look for AOV reports in your POS and ecommerce platforms.
How to use it: When you understand how much your customers spend on average, you can set benchmarks and create goals to grow that figure. “AOV can be influenced with more attentive customer service, by focusing on selling multiple items together, and through visual merchandising, like product placement and display design,” Amanda says.
Look at benchmarks to see AOVs across your industry, or even across retail as a whole. Benchmark data shows AOV at $192 for the entire global retail industry, but you can also filter for your specific industry to gauge what your AOV should be.
Units per transaction
What it is: “Units per transaction (UPT) tells you how many items your customer is purchasing per order,” Amanda says.
How to find it: Most point-of-sale (POS) systems can generate UPT reports.
How to use it: “If you’re consistently selling multiple items together, that can reflect great customer service. If your UPT is low, work on your product placement and store layout, redesigning your website, your buying strategy, and setting each team member up for success with clear accountability,” Amanda says.
Pro tip: To see your store’s average order value and units per transaction over time, select the Analytics tab in Shopify POS.
Gross margin return on investment (GMROI)
What it is: GMROI helps you understand how profitable your business is compared to what you spent on inventory. The higher your GMROI, the better.
How to find it: Divide gross profit by average inventory costs.
How to use it: Knowing your GMROI can help you set prices and shape promotions.
Foot traffic
What it is: Foot traffic measures how many people come into your store during a given period.
How to find it: Cameras and foot traffic tracking software are the most reliable ways to measure this KPI.
How to use it: More foot traffic usually means more sales. Set a benchmark for foot traffic, and if your sales are low relative to it, work on boosting conversions. For example, you might change your store layout to guide shoppers toward your most popular products.
Inventory turnover ratio
What it is: Inventory turnover ratio indicates how many times your inventory is sold and replaced during a given period.
How to find it: Divide your cost of goods sold (COGS) by the average value of your inventory.
How to use it: This metric can help you forecast demand and identify supply chain issues.
Sell-through rate
What it is: Your sell-through rate is the amount of inventory sold in a given period relative to the amount of stock you had on hand during that period.
How to find it: Divide the number of units sold during the period by your stock on hand (the total units available for sale), then multiply by 100:
Sell-through rate = (Units sold / Stock on hand) x 100.
How to use it: Use this KPI to identify popular products, reduce storage costs, plan supply orders, and improve cash flow.
Pro tip: To see the sell-through rate of the products you carry, view the Sell-through rate by product report in Shopify admin.
Customer lifetime value
What it is: This metric shows how much a customer spends with your store over the lifetime of their relationship with you.
How to find it: POS reports can help you find this information quickly. When you collect customer contact information, you can attribute online and in-store sales to the same customer.
How to use it: When you know your customer lifetime value, you can show your appreciation to your most valuable customers to boost loyalty. The probability of selling to an existing customer is up to 14 times higher than selling to a new one, so focus on retention strategies.
Pro tip: To see how much a customer has spent with you in-store and online, select their customer profile in Shopify POS.
Sales per employee
What it is: This KPI shows the value of sales attributed to each employee of your business. “This can give an indication of employee effectiveness, or a measure of the effectiveness of any individual employee’s conversion rate,” says Joseph, the Toronto Metropolitan University professor.
How to find it: You’ll find this metric in your POS system’s staff reports.
How to use it: Sales per employee measures staff performance. Use this data to inform training and staffing decisions. For example, you could schedule your best-performing employees for holiday shifts, or make cuts starting with the lowest performers if you need to reduce headcount.
Pro tip: To see your store staff’s average order value, units per transaction, and total sales, view the Sales by staff at register report in Shopify admin.
Sales per square foot
What it is: This metric measures how much your business earns per square foot of physical retail space. The bigger the number, the more efficient the operation.
How to find it: Divide your total revenue by your shop’s square footage to find your sales per square foot.
How to use it: Because this KPI measures your store’s efficiency, it can inform real estate decisions. Boost your sales per square foot by carrying more products or by stocking higher-margin products.
Year-over-year growth
What it is: Year-over-year growth indicates how your sales and profitability have changed compared to the same period last year.
How to find it: Your POS lets you compare your progress year over year. Comparing annual gross profit year over year is a straightforward way to track this KPI.
How to use it: You can run a profitable business without scaling it. If you do want to grow, you’ll need more revenue or lower expenses. For context, the National Retail Federation forecasts 4.4% growth in total US retail sales for 2026. Use this as a benchmark to judge whether your year-over-year growth is on track.
Pro tip: To compare your store’s total online and retail store sales over time, view the Sales by channel report in Shopify admin.
How to improve store performance
Improving your store performance is an ongoing process, not something you can address once and fix forever. The process is simple: measure your KPIs, benchmark them against your history and industry, act on what the numbers show, then review the results, adjust, and repeat.
Collect data
Improving store performance starts with data, says Joseph: “The more data you have on the consumer, the more you have on the store itself. The more data you have on your employees, the more data you have on all aspects of your business.”
Data is only the starting point, though.
“We need the ability to mine that data into something meaningful that can help us understand what’s really happening,” he says.
Because Shopify POS and online sales share one back office, your sales, inventory, and customer data are automatically collected in one place, cutting manual reporting.
Improve staff training
Use data to inform staff training and help employees improve where they need to. For example, you could identify weaknesses in upselling and train employees to increase average order value. You could also equip staff with tools like email carts and line busting to improve efficiency.
Increase marketing
Boost store performance with more targeted marketing strategies. The more you know about your customers, the better you can reach them with personalized emails and offers.
Enhance store experience
Changing your store’s layout or window displays, adding line-busting tools, and offering interactive workshops are a few ways to enhance the customer experience and improve performance.
Among consumers who bought from a retailer during the 2025 holiday season, about 49% said discounts would keep them loyal and 41% cited free shipping and/or returns, ahead of loyalty programs (29%) and a great customer experience (28%), according to Shopify’s 2025 Global Holiday Retail Report. Prioritizing clear discounts and shipping options can keep customers coming back.
Unify the online and offline customer journey
An omnichannel shopping experience combines online and offline shopping through tools like email carts, in-store pickup, and in-store returns. The goal is to increase sales by making it convenient for shoppers to buy your products.
Read more
- Point-of-Sale Data Analysis: How to Quantify Your Retail Store’s Impact Beyond Sales
- How To Count and Leverage Footfall To Increase Sales
- Post-Mortems and Event Sales: How to Measure Success to Improve Future Sales
- Retail Metrics: 16 Key Metrics for Your Store
- How to Measure Your Store’s Marketing Results (Hands-on Tips)
- Retail Forecasting: A Simple Guide to Predicting Foot Traffic for Small Business Owners (+ Template!)
Store performance FAQ
How do you measure store performance?
You measure store performance by tracking financial, efficiency, and customer-facing KPIs together, not any single number in isolation. Pull the numbers from a dashboard such as Shopify POS Analytics, then check them regularly so trends show up before they become problems. Compare each result against your own history and your industry’s benchmarks to see whether you’re improving.
What is a store performance dashboard?
A store performance dashboard consolidates a store’s KPIs, like sales, average order value, and staff performance, onto one screen instead of showing several separate reports. Shopify retailers get this through the POS Analytics screen or the admin Point of Sale Overview. Checking one dashboard regularly, rather than jumping between reports, makes it easier to catch problems early.
How do you measure store productivity?
Store productivity is measured using metrics like average sales per customer, conversion rate, average basket size, sales per square foot, transactions per day, sales per employee, and inventory turnover rate. Together, these numbers show how efficiently your store converts staff time, floor space, and inventory into sales, and where efficiency issues show up most.
What are the KPIs for a store department?
Common KPIs for a store department include sales volume, average transaction size, inventory turnover, customer satisfaction, conversion rate, average time spent shopping, employee retention rate, and cost per sale. Tracking these together shows whether a department is selling efficiently, keeping shoppers happy, and keeping costs reasonable compared to sales.
How can I check my Shopify store performance?
In Shopify, use POS Analytics for a daily snapshot of sales, average order value, and staff performance, and the admin Point of Sale Overview for order-level totals like discounts and returns. Use POS Analytics for day-to-day monitoring, and the admin Overview for bigger-picture totals across a longer date range.