Announcing Online Store 2.0
Online Store 2.0 is an end-to-end overhaul of how themes are built at Shopify, launched June 2021. While the information in the following article is still correct, it doesn't account for Online Store 2.0 best practices, and may not include references to recent features or functionality. To learn more about how to build with Online Store 2.0, visit our updated documentation.
Visit docsThe hardest part about web performance is pinpointing the slowest pieces of a project that need attention. Without the right approach, improving performance can turn into a guessing game of scouring lists of best-practices, and blindly hoping to see an improvement.
You don’t have time for these guessing games. You need to be sure you’re spending your time on the most impactful changes that address your project’s biggest performance bottlenecks.
Here at Shopify, we take web performance seriously. We know that the faster we make our merchants’ online stores, the more sales they will make, and the more successful their businesses will be.
Our newest free theme, Narrative, is an attempt to raise the bar when it comes to theme performance . By considering performance throughout the entire project, we’ve produced the fastest feature-rich theme in the Shopify Theme Store.
By considering performance throughout the entire project, we’ve produced the fastest feature-rich theme in the Shopify Theme Store.
There’s no cookie cutter solution when approaching web performance. Yes — there are best practices you can apply throughout development, but the reality is that each project needs to be assessed individually. With the right tools and knowledge, you can find your project’s biggest performance bottlenecks and focus your efforts on changes that will make the most impact.
Today, we’ll explore how the Shopify Themes Team considered performance when creating Narrative , and delve into how you too can identify and address your project’s most critical performance bottlenecks.
You might also like: Building Narrative : Shopify's New Theme for Storytelling.
Establishing a performance budget
A performance budget is a collection of performance metrics that exist to establish how fast is fast enough for your project. It’s a valuable constraint that your entire team agrees on and keeps in mind throughout the project.
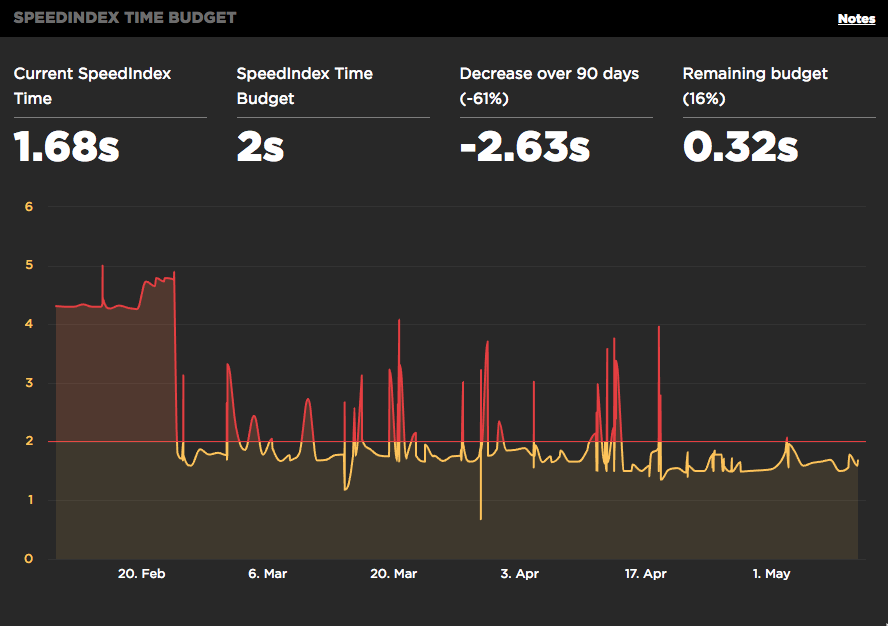
Performance budgets come in all shapes and sizes. It can be a detailed document or just a few basic metrics scribbled down on a piece of paper. Take the time with your team to agree on performance metrics, and then — more importantly — keep them in sight as a constant reminder of this agreement.
|
|
Apple iPhone 6, 3G connection |
Desktop Chrome, Cable |
|
SpeedIndex |
< 5000ms |
< 2000ms |
|
First Render |
< 1600ms |
< 1000ms |
|
Total JS |
< 150kb min+gzip |
|
|
Total CSS |
< 40kb min+gzip |
|
When building Narrative, our budget metrics were influenced by recommendations from theGoogle Rail Model, Google Lighthouse, and WebPageTest. In addition, the budget is a noticeable improvement from what we’d achieved with previous themes.
When establishing your performance budget, it’s important to consider the full spectrum of devices and network connections that might be used to view your theme. Hardware processing power can vary incredibly between high and low-end devices, so make sure you’re specific with your metrics (e.g. ‘iPhone 6, 3G connection’ or ‘Moto G, 3G connection’).
Collecting performance data
Once you’ve established a performance budget, you must become aware of how your project compares to it.
Performance data is essential when determining the sources of bottlenecks and increasing awareness. It allows you to measure a performance improvement’s level of impact, and can be used as concrete evidence when forming an argument to pursue a particular solution. In my opinion, collecting performance data is the single most important practice when considering performance in your project.
In my opinion, collecting performance data is the single most important practice when considering performance in your project.
Here are some of my favorite performance data collection tools we used to become more performance aware when developing Narrative:
Google Lighthouse
In about 15 seconds, Google Lighthouse completes a high level performance audit of any webpage. Similar to PageSpeed Insights, Lighthouse has a small learning curve because it spits out results in plain text. No graphs, waterfall charts, or pie charts — just easy to read text metrics with links to documentation to find out more.
Google Lighthouse was our go-to tool when running quick performance experiments related to improving our theme’s SpeedIndex. It allowed us to quickly validate how much of an improvement we might see from a solution, before investing too much time implementing it across the entire project.
Even cooler, it was recently announced that Lighthouse will be integrated with Chrome DevTools and is currently available for use in Chrome Canary 60.
SpeedCurve
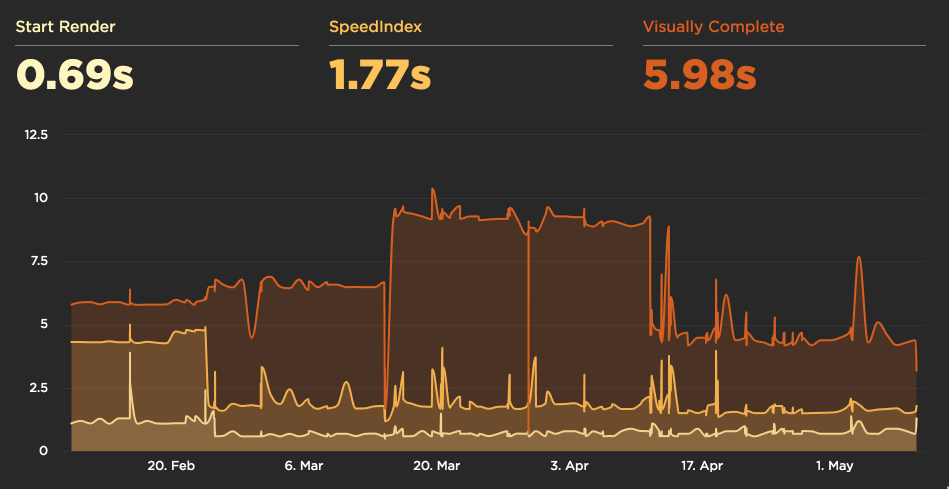
Have you ever audited your website with a service like WebPageTest and found that you get different results every test, even though nothing has changed? There are tons of variabilities in performance auditing that result in a margin of error.
SpeedCurve overcomes testing variability by saving WebPageTest data, and displaying it over time. This allows you to detect outliers in test results, giving you more accurate metrics. Because SpeedCurve tests and displays performance results at least once a day, you always have an up-to-date track record of how your project is performing.
SpeedCurve proved to be incredibly valuable for us throughout the development of Narrative, and worked as a constant reference point for performance metrics as we merged new features. It allowed us to stay on top of any changes that caused significant performance issues, and keep our project within our performance budget.
Chrome DevTools
If you’re serious about performance and want to know exactly what’s causing just about any problem, then Chrome DevTools is your greatest ally. It includes some of the most in-depth performance auditing tools available for your theme. With new features being released every few months, it just keeps getting better and better.
Due to its incredible number of features, DevTools has a pretty steep learning curve. Luckily, Google has invested time into the documentation for Chrome DevTools.
DevTools was used throughout the development of Narrative to pinpoint the exact code responsible for a number of performance bottlenecks. It’s also a great tool for testing page run-time performance for sources of scroll jank, and poor animation frame rate.
Analyzing performance data for bottlenecks and determining high impact solutions

Now that you’ve got data flowing through your veins, it’s time to figure out what it all means. Take a look at your performance budget, and compare those metrics to the data you gathered. What metrics don’t align to those that were set in your performance budget? Which metrics are the furthest away?
Choose a metric of interest that needs improvement and break it down into core components. For example, first render time is a metric that’s composed of a combination of server response time and critical render path. Critical render path is composed of even more metrics. Explore these underlying metrics and what code influences them. Compare these metrics to other projects. Can they be improved? If so, by how much? This is how you discover performance bottlenecks.
Once you’ve identified a performance bottleneck, you can start experimenting with solutions. Use DevTools and Lighthouse to quickly validate experiments. Which solution is quick and easy? Which solution could cause more than a 20 percent improvement? The greater the improvement you receive for the least amount of work is your gauge for measuring level of impact.
By focusing experimentation on a specific bottleneck, your performance work has a sense of direction, and solutions can be compared to others. The more you learn about what influences specific bottlenecks, the better you will be able to assess the level of impact of potential solutions.
The more you learn about what influences specific bottlenecks, the better you will be able to assess the level of impact of potential solutions.
Auditing Narrative, along with previously released free themes, resulted in a number of identified bottlenecks. What follows are some solutions we judged to be as most impactful:
1. Responsive images
One of the simplest and most commonly understood principles of web performance is that the less data you send down the wire, the faster the page can load. Page bloat is only growing as a problem across the internet, so any chance you have to reduce the size of your webpage is a guaranteed win. Smaller webpage size can influence both SpeedIndex and initial render times — two metrics we focus on in our performance budget.
During our data analysis, we saw that some of our themes could have more than 4mb of image data per page. At that size, it could take a user with a 3G connection up to 45 seconds to download and render all of a page’s images. We can do better!
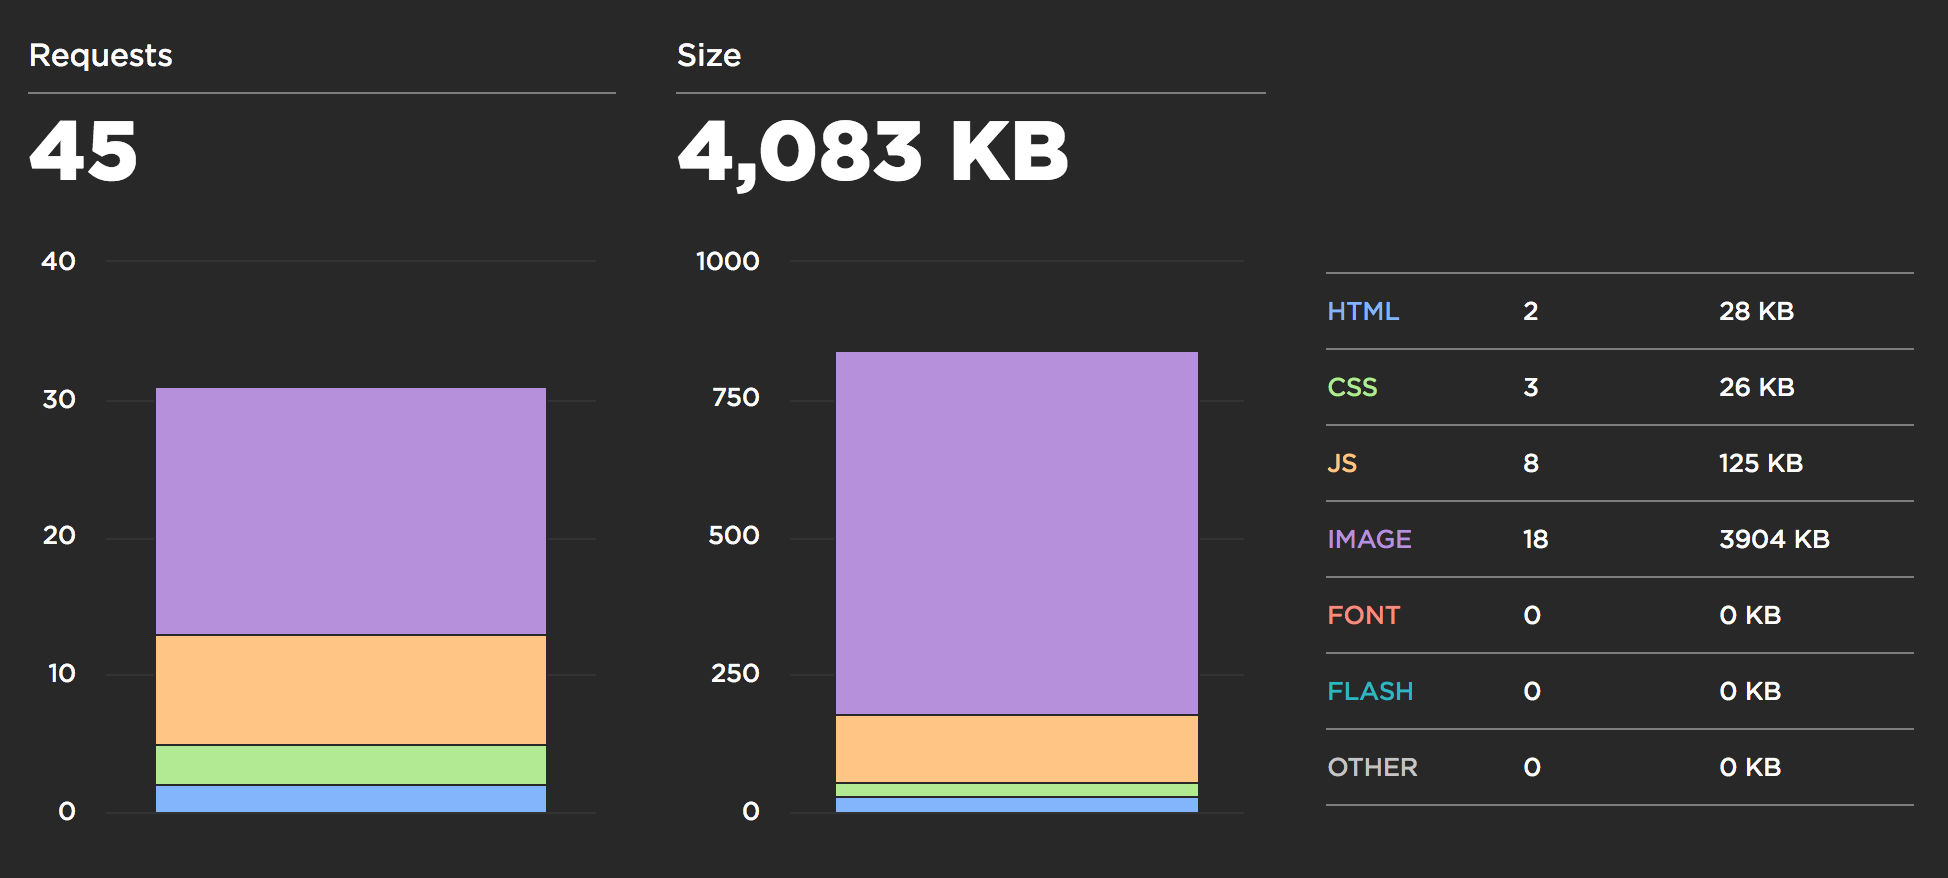
Responsive images promised a high level of impact due to the magnitude of savings we could see across the entire theme, while also focusing on our mobile users. Compared to a few kilobytes of data saved by optimizing other assets, like HTML, CSS, or JS — responsive images gave us the opportunity to shrink overall page sizes by hundreds of kilobytes.
In our Narrative demo shops, we saw a decrease of up to 50 percent in initial page render time, and a decrease of 85 percent in total page weight.
In our Narrative demo shops, we saw a decrease of up to 50 percent in initial page render time, and a decrease of 85 percent in total page weight. For more information, check out this introduction to responsive images on Shopify.
You might also like: Using Responsive Images to Decrease Page Loading Times.
2. Lazy loading images
Another solution we considered when trying to improve SpeedIndex was the order in which images were being downloaded. We noticed that images halfway down the page were being downloaded before images at the top of the page. What resulted was a longer render time for content above the fold, and a slower SpeedIndex.
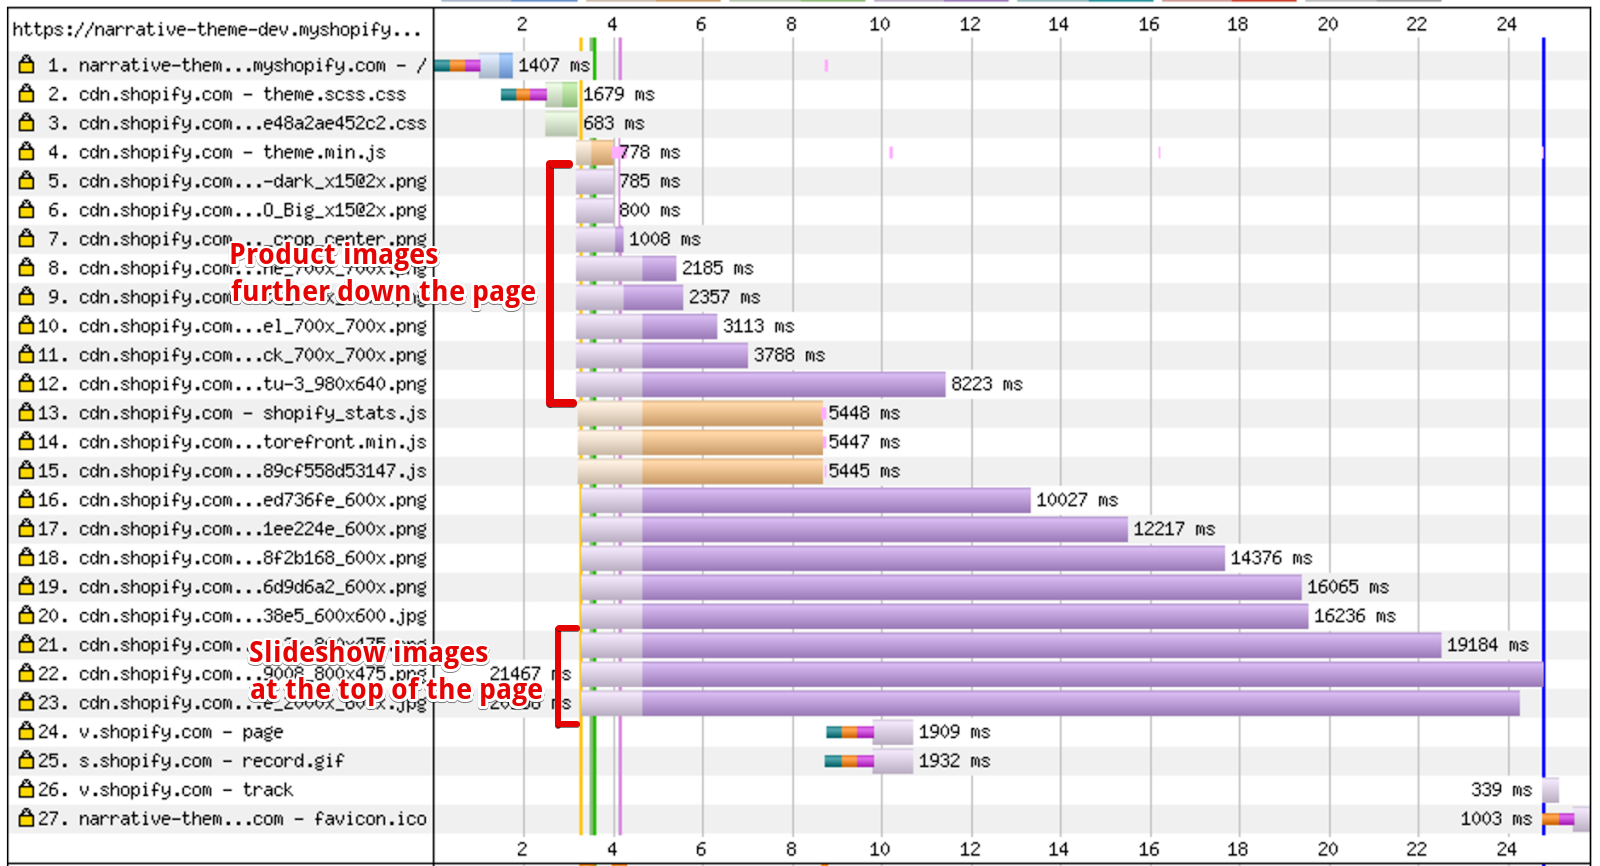
In order to prioritize image downloading, we needed to use a technique called image lazy loading. Lazy loading allows you to control what order images download, and when to download images. With this additional control, we enable devices to only download images when they are needed.
For example, if the user lands on your home page and immediately proceeds to the header navigation, and navigates to another page, why bother downloading images further down the home page? Isn’t that just a waste of bandwidth? By limiting image downloads to only the immediately visible, or soon to be visible, we can decrease the amount of image data our device needs to download and process.
Another great technique available to lazy loading images, which also decreases SpeedIndex, is placeholder images. We used placeholder images as a way to quickly show a low quality (300px) version of our slideshow image on the page, and then show the high-quality version once it’s done downloading.

Lazy loading images is typically accomplished through JavaScript, and with a quick search you’ll discover lots of libraries. We chose an open source library called LazySizes to handle the lazy loading of our images because it’s lightweight, and has the bonus capability of handling responsive images.
3. Critical styles and asynchronous CSS
Loading a webpage is one of the most CPU intensive tasks your device needs to do when browsing the web. The steps a browser takes to render a page are known as the Critical Render Path. Google has some incredible docs on Critical Render Path if you’re interested in learning more.
A discovery we made while auditing our theme was that more than 55 percent of CPU usage, up to the first render, was idle. Initially we didn’t know what this meant, but something felt off. How could the CPU be sitting around doing nothing during one of the most demanding tasks of loading a page?
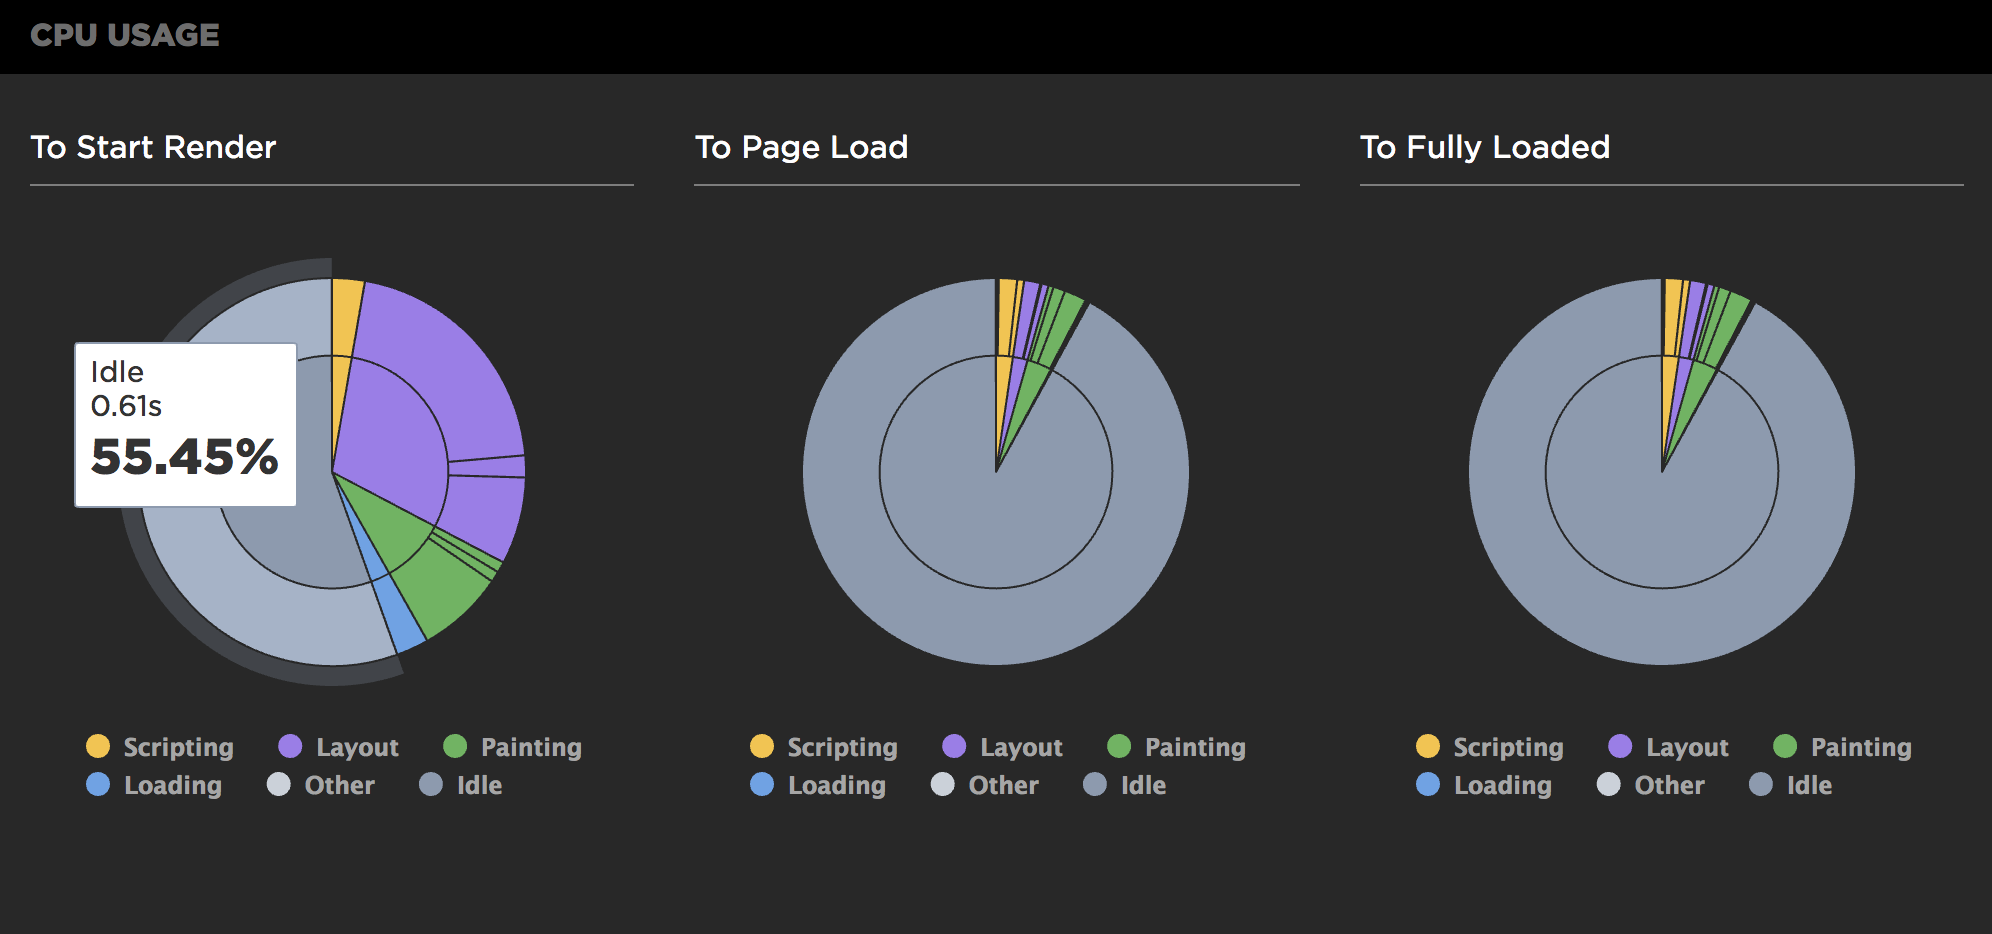
Some research lead to a quick experiment of blocking the requests of any render-blocking external files, and observing the difference in CPU usage in Chrome DevTools. We discovered that our CPU was idle because it was waiting for our HTML document and the main CSS file to finish downloading, before starting to render. Our experiment proved that by excluding the external CSS file, our device could start rendering the page as soon as the HTML finished downloading.
We needed our main CSS file to style the page. No questions there. So how could we include it without it blocking the initial render of the page, and without a flash of unstyled content? The fix was to include Critical CSS and load the external CSS file asynchronously.
Narrative approaches critical styles by manually copying and pasting styles from our main CSS file, to a Liquid snippet. This approach is less flexible than more sophisticated setups that use libraries like Penthouse or CriticalCSS, but it was the most we could do with the time that we had. I’m confident that our approach to critical styles will only get better with future themes.
4. JavaScript cleanup and optimization
One goal made clear by Narrative’s designer was that he wanted long, feature-rich home pages to be a selling point for the theme. As developers, when we hear “feature-rich” we think JavaScript heavy.
Excessive JS leads to poor start-up performance, and ultimately delays initial render and the page from being interactive. We knew from auditing previously released themes that there was room to grow with how we approach theme JavaScript. Our goal for Narrative was to put extra emphasis on developing clean, lightweight JS.
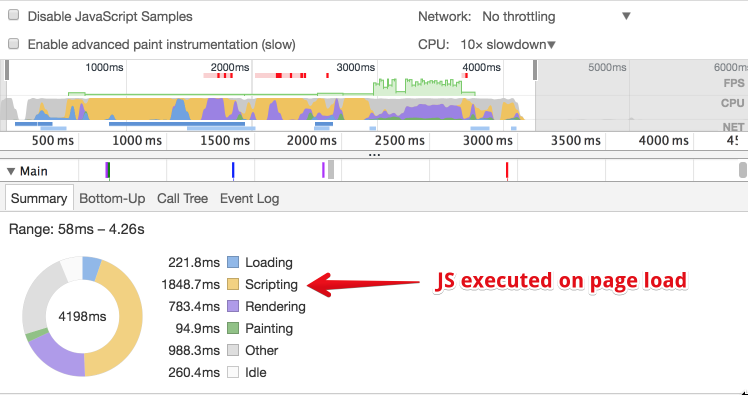
What does ‘lightweight’ even mean? For a while now, I’ve heard the term loosely tossed around the front end world to describe a number of frameworks and plugins. For me, lightweight can be summarized in three points:
- Ship as little code as possible to get the job done.
- Execute code just before its needed or in page idle time.
- Minimize forced DOM recalculations.
These rules can be manifested in a number of ways, such as:
- Avoiding libraries that include lots of features that aren’t used by your project.
- Reducing the amount of JS executed on page load.
- Using flexbox instead of JS to set the height of tricky layout elements.
The more you know about JS, the more aware you’ll be about writing clean, lightweight code. I recommend checking out Kyle Simpsons You Don’t Know JS series, or a number of courses on Frontend Masters.
5. Optimized scroll handlers
Scroll handlers are one of the most appealing features browsers offer. Unfortunately, they’re also one of the most dangerous. Scroll jank is one of the most easily noticeable and unappealing side-effects of scroll handler misuse.
Narrative does a lot of things on scroll: scroll reveal animations, sticky header, sticky elements, and lazy-loading images. We want to make sure that the combined weight of these scrolls don’t cause noticeable jank, and keep our page running at a fluid 60 frames per second.
Paul Lewis talks extensively about this topic in his article Debounce Your Input Handlers.
Designer and developer collaboration
Narrative’s designer, Guillaume Granger, was focused on designing Narrative with a feature-rich homepage, capable of telling the story of a product. Inherently, the demand for a performant experience was even more important due to weight these additional features might inflict.
Developer collaboration throughout the design phase of Narrative was imperative to its success. Making sure that the designs were feasible in a performant manner was equally important to both parties. As Guillaume put it:
“All the attention invested in creating an extraordinary experience falls apart if the execution is less than flawless. Performance and browser compatibility cannot be sacrificed.”
All the attention invested in creating an extraordinary experience falls apart if the execution is less than flawless. Performance and browser compatibility cannot be sacrificed.
What resulted was increased awareness of what parts of Narrative needed to focus extra attention on performance and alterations of the design to ensure performant behaviour. Guillaume writes about one of these alterations involving the featured slider section in his article, Building Narrative: Shopify’s New Theme for Storytelling.
Mark Zeman, the founder of SpeedCurve, has talked a lot about the designer’s role in creating a performant digital experience. I would highly recommend watching some of his talks and sharing them with fellow designers. A talk that I found particularly interesting is Delivering Fast and Rich User Experiences.
You might also like: Getting Started with Slate in 4 Simple Steps.
Make the most impact
There’s no cookie cutter solution when it comes to web performance. Each project brings its own unique set of performance bottlenecks, which need to be individually assessed. With the right tools, you can find your project’s biggest performance bottlenecks.
Collaborate with other disciplines, and contribute to leveling up their work by considering performance.
Once you’ve found your project’s performance bottlenecks, remember to keep these things in mind:
- Create a performance budget with your team so you have a goal.
- Collect performance data frequently.
- Explore and study performance metrics and their founding components.
- Experiment with different solutions to the same problem.
- Prioritize a solution’s level of impact.
- Share your performance discoveries with your peers.
- Collaborate with other disciplines, and contribute to leveling up their work by considering performance.
Read more
- Updated] API Deprecations and Versions at Shopify: What You Need to Know
- How to Optimize Themes for Performance
- How to Refactor a Shopify Site for Javascript Performance
- How to Work With Shopify Theme Blocks
- How Safe As Milk Grew a Successful Theme Partner Business
- How to Use Product Media on Your Custom Shopify Themes
- Tips for an Efficient Shopify Theme Review Process
- How to work with Metafields when building Shopify themes
- Developing Shopify Themes with Accessibility in Mind
- How to Personalize Shopify Themes with the customer Object
What are your theme’s top performance bottlenecks? Tell us in the comments section below!


