There are numerous web developer tools you might use as a front end developer: text editors, package managers, version control systems, and many more. But the one tool we all use is the humble web browser. It isn’t just for viewing websites, it comes with the most powerful dev tools built in as well.
Much like your other tools, these dev tools are packed with features you might not know. Not only that, but not all developer tools are exactly the same. Each of them has their own unique features that are useful in specific situations.
"Not all developer tools are exactly the same. Each of them has their own unique features that are useful in specific situations."
In this article, I’m going to discuss a few of the dev tools that I have found invaluable in my job as a front end developer. They will help with styling your clients’ websites, improving their accessibility, and hunting for bugs. Some of them you can use in all browsers, but some will be specific to Firefox or Chrome. Opening your developer tools is slightly different in each browser, but what I usually do is right-click somewhere on the page and click on “Inspect” (or “Inspect element”).
Let’s get started.
1. designMode (all browsers)
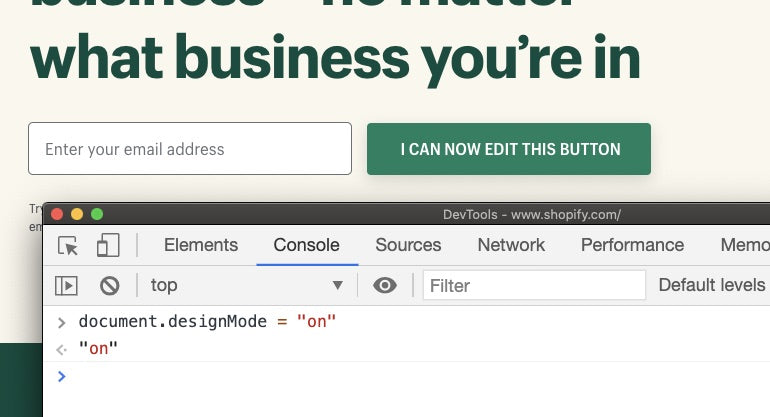
Have you ever wondered what a button will look like when you change the text, or a bit of the content before you take a screenshot? With document.designMode, you can set every element on the page to be editable. Go to the console tab in the developer tools and write:document.designMode = "on"
Now, everything on the page is set to be editable, and you can play around with the page. You can even copy and paste styled content from Word or Google Docs and the styling will be copied as well.
You might also like: 4 Lesser Known but Powerful Web Developer Tools that Increase Productivity.
2. Toggling pseudostate, like hover (all browsers)
In the Elements or Inspector tab in your developer tools, you can view the HTML of the current page and also the CSS of those elements. But, it only shows what is currently rendered. So what do you do when you want to see, and change, the CSS when you hover over a certain element?
That’s where the pseudostate toggles come in. Select the element you want to toggle, and click on the :hov button on top of the Styles panel. Here, you can force the element to be any state you want, and even multiple states at the same time.
3. Accessibility properties (Firefox)
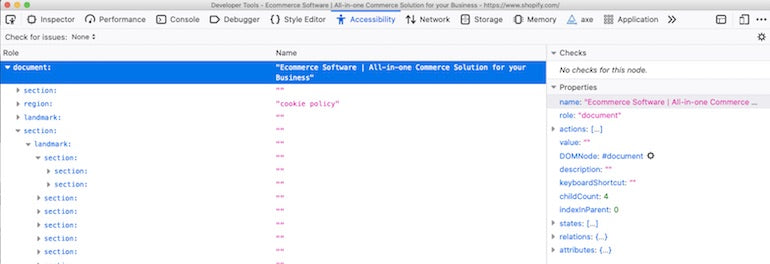
Accessibility is still an underappreciated part of web development. Partially, this is because it can be hard to get right. Firefox tries to help with their Accessibility tab. In this tab, you can go through the document tree, much like the Inspector/Elements tab. It shows the element’s role, its name, and possible issues with it. This can be a bit tricky to navigate, but you can also right-click an element in your browser and choose Inspect accessibility properties. This will take you directly to the element in the Accessibility tab.
To easily find just the issues on your page, there’s a dropdown menu at the top of the tab next to Check for issues:. Here, you can filter which type of issues you want to view. Hover over a line, and the element will be highlighted in the browser.
This should help you improve the accessibility of the site you’re working on with minimal effort.
You might also like: Universal Design: 11 Practical Tips to Make Your Sites and Apps More Accessible.
4. Lighthouse report (Chrome)
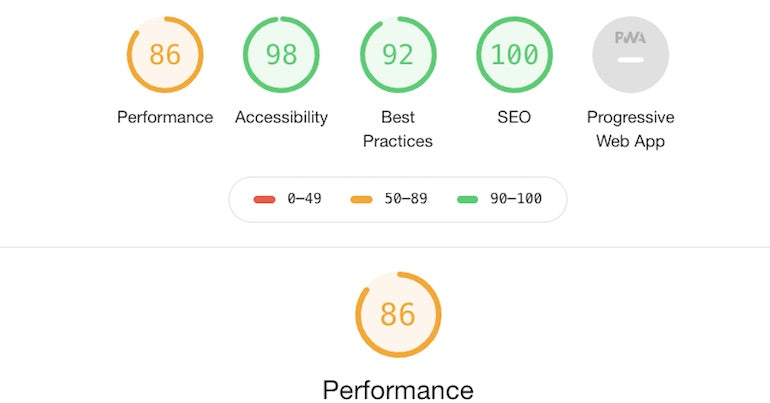
Lighthouse is a tool built by Google for measuring the quality of web pages. It used to be stand-alone, but now, it’s also built right into Chrome’s developer tools.
Go to the Lighthouse tab, select the type of device you want to test, and click on Generate report. This will run an audit of the page you are looking at. It gives you tips on how to improve the performance, accessibility, security, and SEO. It also shows you what still needs to be done if you want to make a progressive web app out of your website.
5. Capturing filmstrips in the Network tab (Chrome)
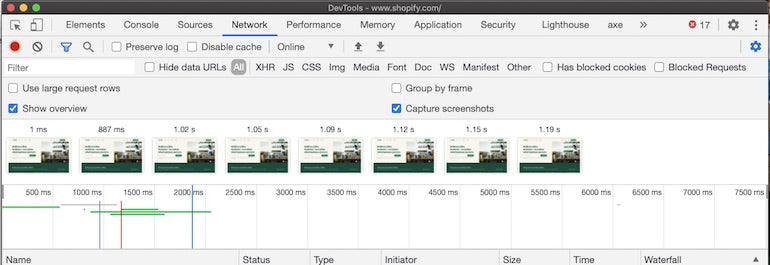
The Network tab in Chrome’s developer tools shows you what files have been loaded and how long it took to load each one. This is great if you want to know which file is taking a long time, or why a certain file hasn’t been loaded. It can also take screenshots while your page is loading.
Click on the cogwheel icon in the top right, and select Capture screenshots. Now, reload your page, and it will capture a filmstrip of your page being loaded. If you double click on one of the screenshots, it will enlarge that screenshot, and you can also step through all of them.
This is great if you want to see what your website looks like when it takes a while to load. It can show you issues in your design, or maybe content that jumps around after an image is loaded. It’s also useful to show you how long it takes before the first meaningful paint, i.e., the first time a user sees the primary content of a page.
6. The Console Drawer and Sensor Emulation (Chrome)
The Console drawer is a helpful little thing that’s active in most of the tabs. It usually shows up at the bottom of the DevTools as a Console pane, but if it’s not there, you can open it by either pressing Escape, or by clicking on the three dots on the top right and selecting Show console drawer.
By default it only shows the console, but if you click the three dots on the top left of the console drawer, it gives you a lot more tabs. One of the most helpful to me is the Rendering tab. It can help you identify different types of issues with the rendering of your site. My favorite feature here is the Emulate vision deficiencies all the way at the bottom. You can use it to emulate the experiences of users who might have blurred vision or color blindness.
7. Grid / Flexbox Inspector (Firefox)
The developer tools in Firefox are much better than Chrome’s when it comes to CSS. One of their most powerful features is the inspector for flex and grid items. With it, you can visualize your grid or flex items to make them easier to understand and debug. You can find it by going to the Inspector tab, and opening the layout tab on the right-hand side.
"The developer tools in Firefox are much better than Chrome’s when it comes to CSS."
If you want to inspect a flex element, select that element, and the details will open on the right-hand side. Here, you can see a visual representation of your item, and how the different sizes are calculated. For example, it could show you that an item has become smaller because it’s set to flex-shrink.
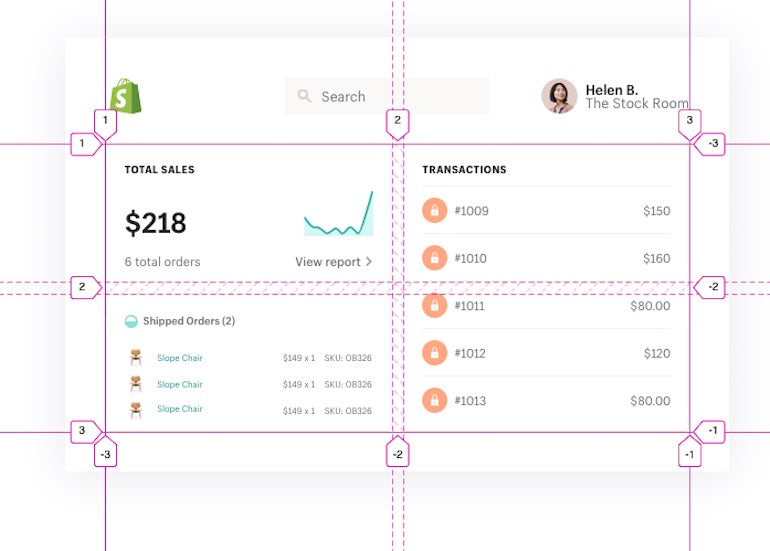
Inspecting a grid container becomes even more interesting. Open the Grid drawer in the layout tab and select the item you want to view the details of. In your browser window, you will now see the grid lines with their numbers or names, the grid areas, and the gaps in between the items. Using this makes it much easier to see where you might have possible alignment issues.
You might also like: 30 Developer Resources to Diversify Your Skill Set.
8. Animations (Firefox)
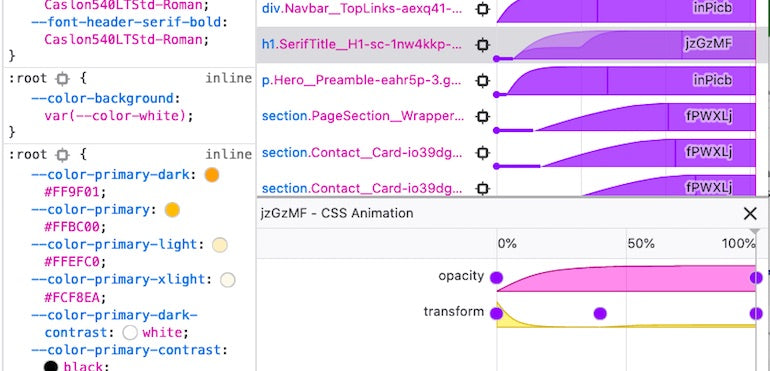
Another nifty feature is the animation inspector. You can also find this on the right-hand side of the Inspector tab. Select an element with a CSS animation (or one of its parents), and it will show you a timeline of that animation. If you click on the timeline, a new panel will open that shows you timelines of each CSS attribute that changes in the animation. You can go back and forth to specific points in the animation to help you figure out your animation problems.
9. Console utilities (all browsers)
You may have used the Console tab before to write and test some JavaScript. But, the browser dev tools come with their own API to help you out a little bit. Be careful though, they will only work if you call them in the dev tools and not in your own code. Here are a few of the functions that are built into all browsers:
-
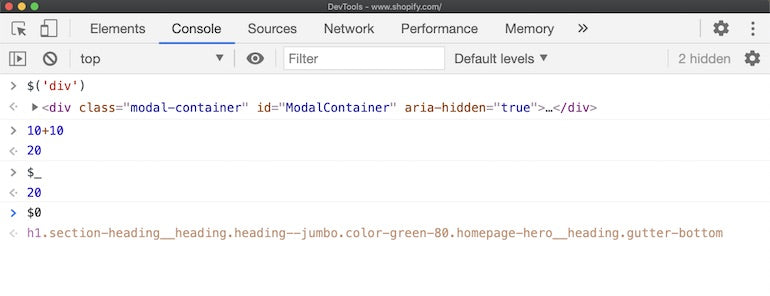
$and$$: These are aliases fordocument.querySelectoranddocument.querySelectorAll. For example,$(‘div’)will select the firstdivon the page. -
$_: This will return the most recently evaluated expression. For example, if you’ve written10+10, then$_will contain20. So now, you can do$_ + 10and it will evaluate to30. -
$0: This is a reference to the currently selected element in the Element/Inspector panel. In Chrome’s dev tools,$1through$5also work as historical references to elements selected before. -
clear(): This will clear the console history. -
copy(object): This will copy an object as a string. For example,copy($0)will copy the HTML of the currently selected element.
These are just a few of the built-in functions and expressions. Google has a list on their dev tools page. Firefox keeps theirs on MDN.
10. Live Expression (Chrome)
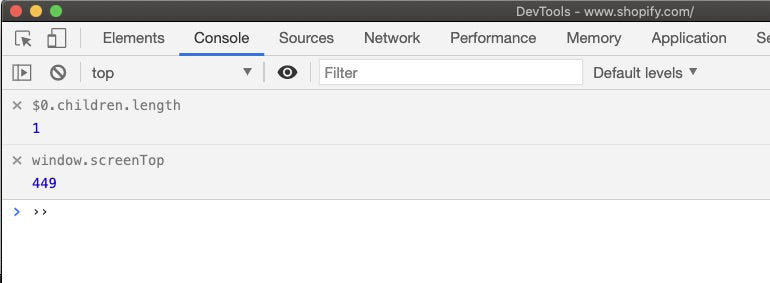
If you’ve ever been in a situation where you had to keep typing the same JavaScript expression in the Console over and over again, you might have been better off using Live Expressions. If you go to the Console tab in Chrome’s dev tools, there’s a little eye icon on the top. If you click that, it will create a new live expression that will keep itself updated.
Not only can you see changes in certain variables, but you can also combine this with the expressions like $0.
And many more dev tools...
These are just a few of the very useful dev tools that browsers have built-in for web developers and designers. As you can see, the developer tools can help you with a variety of different tasks that you face in your work. It can help you with performance debugging, accessibility improvements, designing your website, and much more. And, there are even more features that I haven’t covered. If you’re interested to know more, you can go to the Chrome DevTools and Firefox Developer Tools documentation sites. Or, you can follow Umar Hansa’s Dev Tips, where he mostly shares fun little tips for Chrome DevTools.
Read more
- Build with Hydrogen: Developer Preview Now Available
- Free Webinar] Developing with Shopify: Using JavaScript to Add Ecommerce to Any Website
- How Google’s AMP Project is Changing the Mobile Web
- Getting the Most Out of Chrome Developer Tools: 4 Modern Features You Need to Know
- 15 Tools to Customize Your Terminal and Command Line
- Dirty CSS Hacks for Responsive Emails
- The 21 Best Atom Packages for Front End Developers
- A Modern Approach to CSS Pt. 2: Building Resources
What has been your favorite feature? Or, have you used something less well-known? Share it with us in the comments below!


