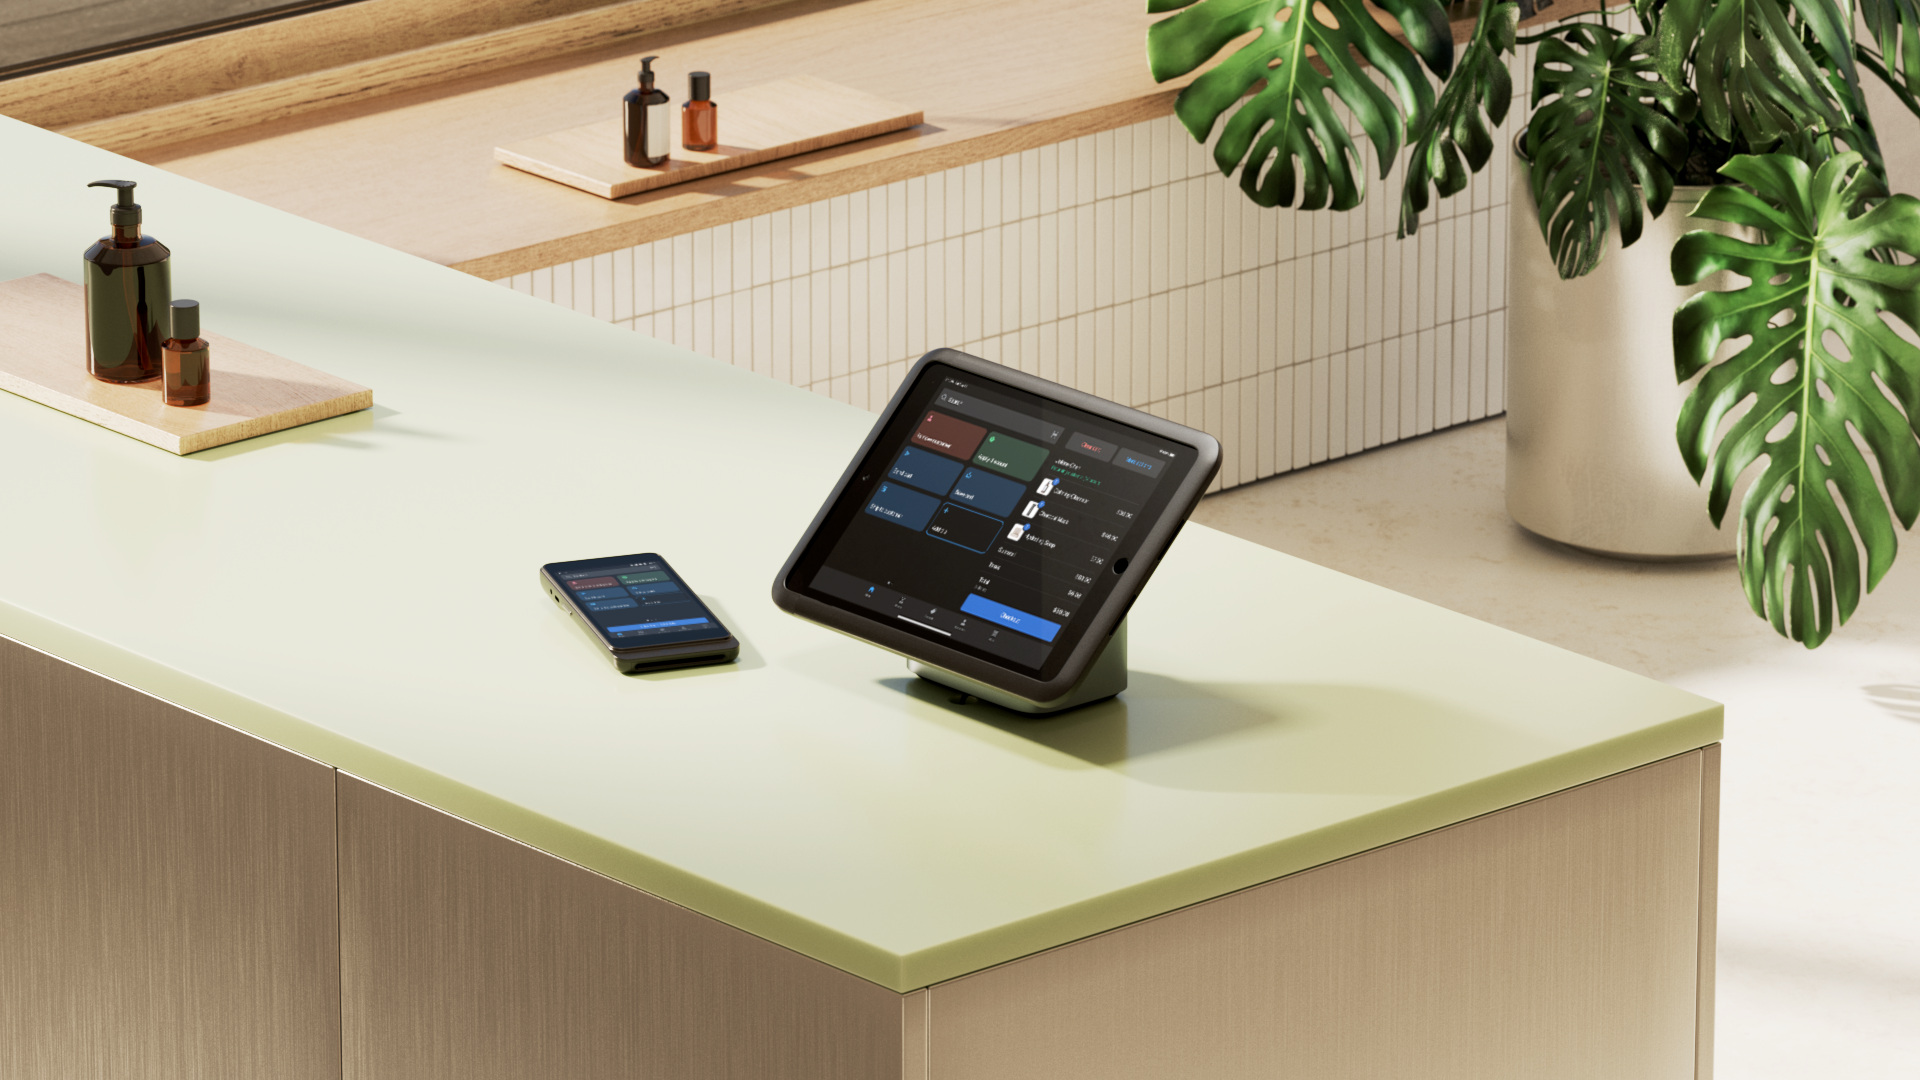
Retailer performance reports give brand owners valuable data on inventory, sales, and customer activity, and can be used to gain insights on how those factors influence each other.
Still, many retailers don’t regularly review these reports, even when they can be easily accessed through a central store performance dashboard. According to Shopify’s November 2025 merchant survey, while 77% of participants track sales and total revenue, less than half track key retail metrics like profit margin, average order value (AOV), or conversion rate.
This guide covers the main retailer performance reports. It explains what each report measures and how to apply the data to inventory planning, merchandising, customer acquisition, and growth.
What is a store performance dashboard?
A store performance dashboard centralizes retail metrics in one location. It brings sales, inventory, customer, and financial data into one place so retailers can monitor daily results and generate reports.
Reports are used to view a static snapshot of past data, like a previous month's sales. A retailer can define the parameters for a report to view a relevant month, quarter, or year, depending on the goal of the analysis. Dashboards deliver a live look at current metrics, including today's sales, inventory levels, profit margins, and conversion rates.
According to Shopify’s November 2025 merchant survey, 41% of established merchants review their finances daily, and 69% check them at least weekly. With a dashboard, retailers don't need to pull reports each time they check, as the data is already visible once the dashboard is set up according to retailer preferences.
Shopify retailers can use the platform's built-in reporting and analytics to make better decisions, faster. Choose from over 60 prebuilt dashboards and reports—or customize your own—to spot trends, capitalize on opportunities, and supercharge your decision-making.
Inventory reports
Inventory reports show how products move through a retail business. They track what’s selling, what’s sitting, and where stock levels need attention. These reports prevent two common problems. The first is tying up too much cash in slow-moving stock. The second is missing revenue when popular items run out before replenishment arrives.
Tracking the flow of your inventory can also inform decisions around procurement, marketing, pricing, and more.
Use these inventory reports to align stock levels with demand:
- Sell-through rate by product
- ABC analysis by product
- Percent of inventory sold
- Days of inventory remaining
- Month-end inventory snapshot
- Month-end inventory value
- Shrinkage report
1. Sell-through rate by product
Sell-through rate shows how much of your inventory has sold compared with the amount received from a supplier. It’s usually shown as a percentage.
Use a Sell-through rate report to see which products are selling faster than expected. A high sell-through rate may mean it’s time to reorder or move more stock to a high-demand location. A low sell-through rate may point to overbuying, weak demand, or a pricing issue.

You can also set automated reorder points to get low-stock notifications and ensure you have enough lead time to replenish a product’s inventory before quantities reach zero. This helps you avoid stockouts that erode margin and customer confidence.
Review sell-through weekly for seasonal products, new launches, and fast-moving items. For stable products, consider a monthly review.
2. ABC analysis by product
An ABC analysis groups products by their contribution to revenue in relation to their proportion of your total inventory:
- A-grade products generate the most revenue from a smaller share of inventory.
- B-grade products have moderate sales volume and represent a moderate share of total inventory.
- C-grade products produce the least revenue and represent a large proportion of inventory, so they often take up more shelf or storage space than they should.
Use the ABC analysis by product to decide where to focus buying and replenishment. A-grade products should always be available. B-grade products may need closer review by location or season. C-grade products may need to be marked down or bundled, with future orders reduced.
3. Percent of inventory sold
The percent of inventory sold report shows how much of your available stock has sold during a set time period. It gives you a way to compare sales progress across products.
This metric tracks whether a product is selling through at the expected pace:
- A low percentage can mean demand is weaker than planned.
- A high percentage may mean the product needs a faster reorder cycle.
Review this report weekly during promotions and product launches. For ongoing inventory planning, review it monthly.
4. Days of inventory remaining
Days of inventory remaining estimates how long your current stock will last based on recent sales volume. It shows when a product may run out if sales continue at the same pace.
One way to use this report is to compare remaining stock with supplier lead times. If a product has 10 days of inventory left and the supplier typically takes 21 days to deliver, the store may need to transfer stock from another location or see if a faster delivery is feasible. Next, adjust automatic reorder points to avoid running low in the future.
5. Month-end inventory snapshot
The Month-end inventory snapshot report shows the quantity of each product variant you have in stock at the end of a given month. It focuses on designated as “available” inventory only, which means it excludes inventory that is labeled “committed” to unfulfilled orders as well as “incoming” units that are part of a transfer.
This report helps you understand stock positions over time at the variant level, and identify whether inventory is rising, shrinking, or going negative at month-end.
Ending quantity shows you the trackable inventory available for sale at the close of the selected period, not total physical stock in every state. If negative quantities appear, that can indicate overselling or products without inventory tracking enabled.
A good reporting cadence is monthly, since the report is designed as a month-end view, though many teams review it during each month-end close and again during periodic stock planning.
6. Month-end inventory value
The Month-end inventory value report shows the value of your month-end available inventory by multiplying each variant’s cost per item by its ending quantity. It shows how much capital is tied up in inventory across all of your locations and lets you ascertain whether stock levels are balanced with sales performance.
You can use this report for financial review, margin-analysis support, and inventory valuation discussions. Bear in mind that its usefulness depends on accurate cost-per-item data assigned to all products.
A standard monthly review cycle can cover finance, inventory reconciliation, and end-of-period reporting, with additional reviews at quarter-end or year-end if your team uses inventory value in broader business reporting.
7. Shrinkage report
A shrinkage report shows the difference between recorded inventory and actual inventory on hand. Shrinkage can come from theft, damage, supplier errors, miscounts, or process issues.
The Shopify admin doesn't have a default report for shrinkage. Retail stores track it using the inventory adjustments report or a custom report. These tools show inventory losses and discrepancies by SKU, location, and adjustment reason.
"We created custom reports that show us exactly how our Charleston store is performing compared to our other sales channels. This visibility helps us monitor sweet spots in store traffic, determine optimal staffing levels, and make data-driven decisions about everything from inventory to store hours,” says Kenny Haisfield, founder at Kenny Flowers.
Sales reports
Sales reports give you data on sales across your entire business, or within specific locations or sales channels.Use these reports to compare online and in-store performance, or compare the performance of multiple sales locations. They can help you evaluate how staff, geography, and order value affect revenue over time:
- Sales by channel
- Daily sales report
- Average order value (AOV)
- Sales by billing location
- Retail sales by staff member
8. Sales by channel
The Sales by channel reports (Total sales by channel or Net sales by channel) group sales results by channel so you can compare revenue across different selling surfaces, such as your online and brick-and-mortar stores. Data refreshes within one minute, giving you a near-real-time view of your sales.
You can use this report to help decide where to invest marketing budget or where to improve merchandising. If one channel is growing faster than the others, it may deserve more inventory, better promotions, or a closer look at margin.
Of course, revenue alone doesn’t show the full picture: Compare channel sales with costs before making major budget decisions.
9. Daily sales report
The daily sales report tracks daily sales activity across a selected period. Data refreshes within one minute.
Stores use this data to monitor short-term performance shifts and track daily activity against active promotions or seasonal trends. Isolating a single day doesn't provide a complete performance trend. Monitoring occurs daily, with a summarized trend review performed weekly.
You can track daily sales reports over multiple weeks to detect patterns. If sales are always much higher later in the week, you could consider promotions to get customers in your store on Mondays and Tuesdays.
10. Average order value (AOV)
The Average order value over time report tracks the average amount spent per transaction over time. This metric highlights the effectiveness of merchandising, product bundling, and pricing strategies.
A rising AOV can mean customers are buying more expensive products or adding more items to each order. It can also mean fewer low-value orders are coming through, so look at order volume as well to get a more complete picture.
11. Sales by billing location
The sales by billing location report groups sales by customer billing location to display geographic distribution and regional demand.
The data supports tax and market analysis across regions. Because billing details don't always match the shipping destination, fulfillment planning requires separate verification.
Geographic trends can be reviewed monthly, with comprehensive business reporting completed at the end of each quarter.
12. Retail sales by staff member
The POS total sales by staff member report displays point-of-sale (POS) sales associated with individual staff members. This report doesn't include online transactions and refreshes within one to five minutes.
Store managers use this data to track staff contributions and plan scheduling. Performance reviews require balancing sales volume against shift lengths and store traffic. High-performing staff members may also be considered for training new hires or sharing sales-boosting strategies with colleagues whose numbers are lower.
You can also review your Gross profit by POS location. High-traffic physical stores have different overhead and discounting patterns than online storefronts. Comparing store margins side by side in Shopify helps you know which locations are driving your bottom line and which might need a pricing or discount audit.
Retail reports
Review these POS reports to learn what customers buy in-store and where those sales happen:
13. Retail sales by product variant
The POS total sales by product variant report breaks down gross sales for top-selling POS product variants. It includes fields for product title, variant title, variant SKU, and net quantity.

Net quantity reflects the number of sold items minus returned items. Shipping charges aren't included because single shipping fees don't distribute across multiple items in an order.
Stores use this data to analyze performance by size, color, or other SKU-specific attributes. Net quantity helps distinguish between strong sell-through and sales offset by returns.
14. Retail sales by product type
The POS total sales by product type report groups retail sales by category and organizes them by POS location. Product types represent categories like hats, shirts, or shoes. Like variant reports, this view uses net quantity to calculate actual sales volume after returns.
The report isolates category-level performance to reveal which product types generate the most in-person sales. Retailers use this overview to balance assortments and allocate floor space. If shoes drive most in-store sales but apparel occupies more floor space, the store manager may need to rethink layout, displays, or buying plans.
15. Retail sales by POS location
The Total sales by POS location report displays total sales for each physical store. It excludes online sales to isolate in-person transactions across brick-and-mortar spaces.
Retailers use this report to measure location performance and compare store output. Higher sales don’t always mean a store is performing better. Store size, trading hours, staffing, rent, and footfall all affect the final number.
Customer reports
These reports show where new buyers come from and how often they come back:
16. Customers by location
The Customers by location report displays data for new customers organized by geographic location. New customers are grouped by their most recent shipping location, showing the number of new buyers who placed their first order during the selected timeframe.
Track where customer acquisition occurs geographically and identify the regions contributing the most to first-time buyers. The report reflects new customers only; it doesn't map the entire customer base.
17. New vs. returning customers
The New vs. returning customers report displays the volume of first-time and repeat buyers within a selected period.
A first-time customer is someone who placed their first order with your store, while a returning customer has at least one prior order in their history. The report groups data by day, week, month, quarter, or year.
While tracking individual customers can be challenging if you’re using different systems to run your online and physical stores, it’s easy with Shopify. When a customer shares their email address or phone number with you, Shopify creates a unified customer profile to store their data. This lets you track customer behavior across several channels.

Point-of-sale analytics
These reports highlight trends in sales, discounts, and customer behavior at the register, insights often hidden in disconnected systems:
18. Net sales
Net sales are the sum of a store’s total sales minus its returns and discounts. The calculation subtracts discounts and returns from gross sales. Net sales don't include shipping charges or taxes.
Use this report to evaluate the true revenue contribution from products. This metric indicates sales performance more accurately than gross sales for businesses with frequent promotions.
Benchmark net sales across each channel with Shopify Analytics. It uses data from millions of other stores like yours to evaluate how you stack up in your industry.

19. Average items per order
The average items per order report tracks the average number of items in a customer basket. POS analytics displays this metric as items per order and compares the data against the same day from the previous week.
The metric helps store owners analyze basket size and track whether customers buy more units per transaction. Businesses evaluate this figure alongside average order value to determine if higher item counts reflect cross-selling or lower-priced items.
20. Top products by net sales
The top products by net sales metric identifies the best-performing products based on total net revenue. POS analytics displays the top three product variants 0sold during the day, the number of units sold, and total sales.
Stores use this report to track high-performing products and identify variants that generate the most in-store value.
Retail reporting best practices
These best practices can improve store performance when followed:
Unify your sales channels
The Shopify admin centralizes sales data from online stores, retail locations, and connected channels. It keeps ecommerce and POS data in a single reporting system, so you don't have to manage separate tools.
A unified setup tracks omnichannel activity. For example, customers can buy online and return items in-store (BORIS), or browse in store and reorder later online. Retailers using Shopify reporting don’t lose sight of their customers across these multichannel transactions, as unified commerce combines all of their activities into a single business view.
Create a routine
Retail metrics require different review cadences so merchants don't spend critical time tracking slow-moving data. Establish an analysis schedule based on these intervals:
- Daily: Track metrics like sales, inventory levels, and foot traffic to address stockouts or slow sales.
- Weekly: Review performance trends, staffing efficiency, and promotional results to adjust operations.
- Monthly or quarterly: Analyze metrics such as profit margins, category performance, and customer trends to inform demand planning.
Building report analysis into administrative schedules ensures retail teams don't fall out of alignment.
Read more
- Social Commerce Strategy: Improve Your Social Selling With These 11 Strategies
- Enterprise Integration: Fueling Growth in the Digital Era
- What Brexit Means for Ecommerce
- What Are Ecommerce Operations & How to Improve Them (2025)
- Shopify has the best total cost of ownership in commerce, with up to 36% better TCO than the competition
- Social Commerce Examples, Features, and Platforms to Uplevel Your Business
- What Is a Good Shopify Speed Score—and Does It Matter?
- How to Build a Successful B2B Sporting Goods Operation
- Ecommerce Navigation: How to Help People Find and Buy Your Products
- Website Performance: What It Is & How To Assess
Enterprise Integration FAQ
What is the main goal of enterprise integration?
To connect systems, data, and processes so information moves reliably across an organization. The aim is consistent data, less manual work, and faster, better-informed decisions. A clear enterprise integration plan sets out which systems to connect first and how they'll share data.
What are the main types of enterprise integration?
Common types include application, data, process, API, cloud and hybrid, B2B, and event-driven integration. These overlap, and one workflow can use several at once. Separately, teams choose target integration patterns such as point-to-point, ESB, or hub-and-spoke to structure how those connections run.
How do APIs help with enterprise integration?
APIs let systems share data and functions through defined endpoints, without exposing internal code. Reusable APIs make new integrations faster and cheaper to build. Good API management keeps those APIs secure, governed, and monitored as their number grows.
What risks should enterprises plan for?
Incompatible data formats, synchronization errors, security gaps, and unclear ownership are the integration challenges to plan for. They get harder to fix as systems multiply, so address them early. Controlling data access for AI agents is a growing concern. Agents need data, but only within clear permissions.
How should businesses measure integration maturity?
Track reusable API share, deployment speed, error rates, ownership, documentation, and versioning. Improvement across these measures signals a maturing practice.