For digitally native brands, there comes a time when the thought of opening a physical store goes from being a distant goal to being a viable way of expanding into new markets, reaching and engaging with more customers, and continuing your growth trajectory.
If that sounds like you, welcome to the wonderful world of brick-and-mortar retail!
But the same data-driven approach to growing an online store may not seem possible for your physical store. Sure, you can see how many sales you make each day, but how do you measure your retail store’s contributions to your brand’s overall growth?
That’s a challenge many omnichannel merchants face: making the connection between online and offline sales, and making sense of your physical store’s overall impact. Thankfully, your point-of-sale (POS) data can help bridge that gap when interpreted and used correctly.
When used in tandem with ecommerce data, POS system data unlocks valuable insights that help you be more cost-effective with your inventory purchasing, measure your store’s impact on online sales, customer loyalty and lifetime value, and even suggest when (and where) to expand your network of retail stores.
What is POS data?
POS stands for point-of-sale. Your POS software collects data whenever you process a transaction at your retail store. Once you checkout a customer, the data from that transaction feeds into several categories: inventory, sales, product, customer, and staff.
What are the different types of POS data?
Before we explore the ways you can pair ecommerce and POS system data to grow your business, let’s first review the different types of POS data and why they’re useful.
POS inventory data
Whenever you receive, sell, return, or exchange a product, the inventory levels of that particular SKU adjust in your POS system to reflect how many units of that item you have and where they’re located.
Why is POS inventory data useful?
Inventory is the backbone of running a retail business. And when you run both an online and physical store, ensuring inventory levels are accurate is even more essential. With accurate inventory levels that adjust automatically as you make sales online or at your store, you can avoid stockouts and let customers know with confidence if you have a product in stock.
💡 PRO TIP: When you use different platforms to run your online and retail stores, inventory discrepancies are more likely to happen as a result of both systems not being in sync with one another. This can lead to more frequent inventory counts.
POS sales data
Sales data gives you both macro- and micro-level insights. At the macro level, POS sales data shows your gross and net sales and the total number of units you sold over a given period of time. At the micro level, sales data shows your store’s average order value, average items per order, and net sales for the day.
Why is POS sales data useful?
Sales data can help you run a more profitable business. It helps you know what times of the day or year are your peak sales periods, and quantify how effective your retail team is at converting foot traffic into sales.
It also feeds into your inventory and product reports, and enables you to reorder your bestsellers before running out of stock, run promotions for products that have been languishing on shelves or in your warehouse for longer than you’d like, and avoid stocking up on products or brands that historically don’t sell well.
💡 PRO TIP: Use Shopify’s Sales over time report to see which times of day, days of the week, and months of the year are your peak sales periods across each of your retail stores. This can help you schedule enough store associates and plan ahead for important times of the year, like the holidays.
POS product data
Product data in your point-of-sale system typically falls into one of three categories: cost, sales, or profit. Together, that data feeds into your sales and financial reports and helps you know which items have the highest profit margins, how many units of a product or variant you’ve sold, and the revenue each product generates.
Why is POS product data useful?
Product data differs slightly from sales data because, while sales data helps merchants understand how much sales they’ve made over a given period of time, product data shows your top products by net sales, top products by number of units you’ve sold, and the gross profit of each item you sell.
💡 PRO TIP: Use Shopify’s Sales by product report to see which products are your bestsellers, the Sales by product variant SKU report to see which variants of your products are your bestsellers (a specific t-shirt size or color, for example), and the Sales by product vendor report to see which of the vendors you buy from are most popular.
POS customer data
Customer data in your POS system shows you how long someone has been a customer, how often they’ve bought from you, how much they’ve spent, and exactly what products they bought.
Where customer data really gets interesting, though, is when it’s connected to your ecommerce data. Merchants who use Shopify to unify their online and retail stores, for instance, can see how often returning customers shop with them again in-store or online, as well as what they bought, their average order value, and their total lifetime value. Those insights have helped brands like KOTN understand how their omnichannel approach has positively impacted overall sales and customer loyalty.
Proof in the pudding: Our Omnichannel customers (folks who shopped in both our retail store and website) have a 2.5x higher LTV than both our repeat web-only customers, and repeat retail-only customers. Retail experience and trust + online convenience = loyalty & advocacy boost.
— Ben Sehl (@benjaminsehl) July 26, 2021
Why is POS customer data useful?
Customer data is helpful for personalizing how you market to your customers, seeing what percentage of your revenue comes from new and repeat customers, and even pinpointing the difference between the lifetime value of single-channel customers (ones who either shop exclusively in-store or online, but never both) versus customers who shop both in-store and online.
💡 PRO TIP: Use Shopify’s First-time vs. returning customer sales report and add the Sales channel by name column to see the total sales attributed to new and returning customers for your online store and across each of your retail locations.
POS staff data
Each time a store associate processes a sale using your POS software, that sale is attributed to their user profile. This is especially valuable for store managers who want to track the sales productivity of their teams and ensure everyone is contributing to the store’s sales goals.
Why is POS staff data useful?
POS staff data helps store managers track each store associate’s average order value, items per order, gross and net sales, and even the amount of returns or discounts they’ve processed with the point of sale device. That information helps them reward top-performing store associates and identify ones who may benefit from more sales training.
💡 PRO TIP: Use Shopify’s Retail sales by staff at register report to see the average order value, items per transaction, and total sales value for store associates across all of your retail store locations.
4 ways to use POS and ecommerce data together
Now that you understand the data your POS software collects, it’s time to explore a few ways you can pair ecommerce and store data and bring data-driven decision making to your retail store with Shopify.
1. Understand how physical stores lift online sales and customer acquisition
Asides from the sales per square foot and net sales they generate, merchants new to physical retail may struggle to quantify the impact of their stores. But direct-to-consumer brands like Allbirds also look at total online sales and net-new customers in the area around their physical stores to measure their impact.
In the three months after opening its Boston Back Bay location, web traffic in the area rose 15%, and Allbirds saw 83% more new customers in the neighborhood.
Rather than measuring the impact of your retail store exclusively on its sales, consider looking at how your store impacts online sales from the surrounding area. Retail stores have a halo effect that can serve as a valuable marketing vehicle that helps acquire new customers and lift online sales as well.
Use these Shopify reports:
- Use the Sales by billing location report to measure any lift in online sales in the area surrounding your retail store.
- View the Customers over time report to analyze how many first-time customers shopped with you for the first time at your retail store.

2. Improve customer retention and lifetime value
Customers who shop both online and in-store also tend to shop more frequently with your brand, spend more each time they shop, and remain loyal customers for longer.
Allbirds, for instance, uses its POS and online store data in tandem to compare the value of shoppers who went to a store or shopped online alone versus shoppers who visit both retail stores and their website. What they found was that shoppers who use both channels spend more than single-channel shoppers.
Shoppers who visited both Allbirds physical location and the website spent 1.5 times more money than a customer who went to a store or shopped online alone.
In addition to increasing how much shoppers spend, consider measuring how your store influences repeat purchases, customer retention, and lifetime value. As brands like Warby Parker have found, retail stores not only help acquire new customers, but keep them coming back.
Our retail stores serve as valuable marketing vehicles for introducing new customers to our brand and driving repeat purchases and, in turn, positively impact our sales retention rate.
Indeed, customers who shop online and in-store tend to buy more and stay customers longer. And using POS data and your ecommerce data, you can quantify that impact for your own brand.
Use Shopify’s First-time vs. returning customer sales report to:
- Compare the average order value of new and return customers
- Contrast how average order value differs with in-store vs. online shoppers
- Review the percentage of your brand’s in-store and online sales that come from new and returning customers
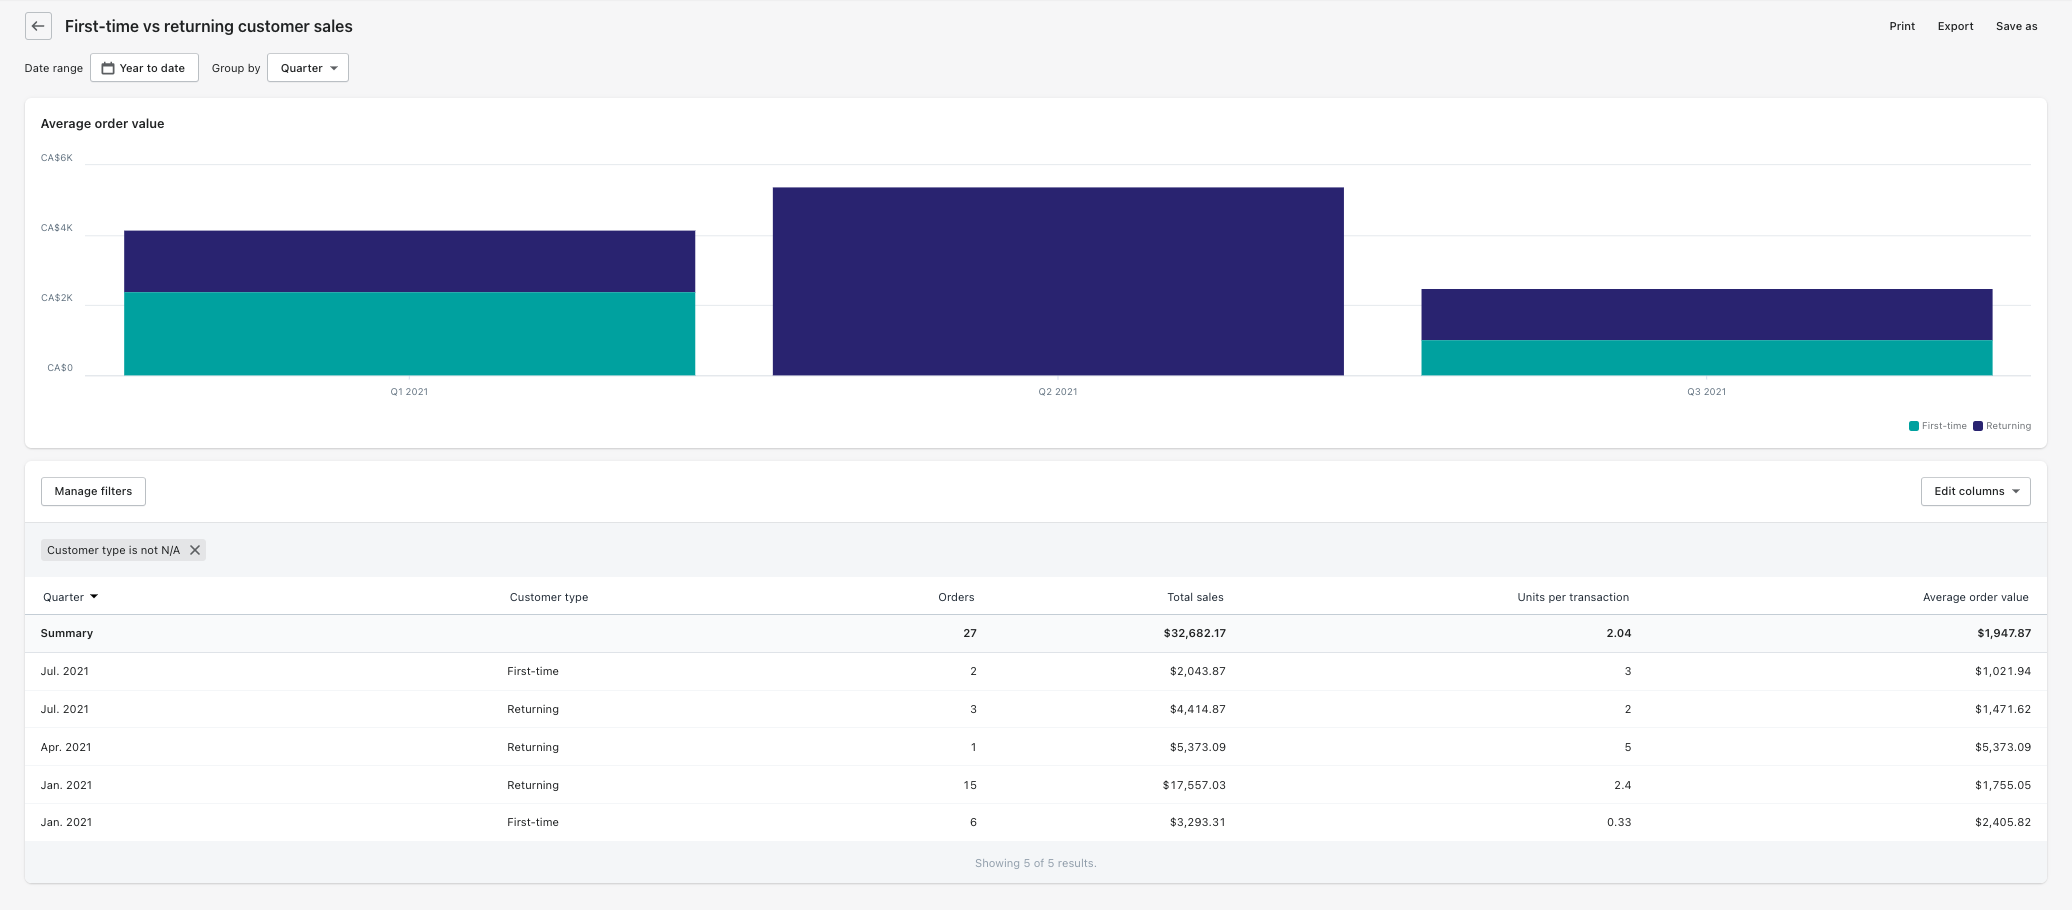
Shopify’s First-time vs. returning customer sales report showing how new and loyal customers buy from your brand over time.
3. Know when (and where) to expand your network of retail stores
Merchants often refer to their online sessions by location to see if there are any opportunities to increase sales and expand their online store brand into new markets, but what about using similar location-based sales data to spot opportunities to open retail stores in different neighborhoods, cities, or countries?
This is where analyzing your online store’s sales by location can be helpful. Look at the shipping country, city, region, and even postal code of your online sales. Are a statistically significant number of sales coming from one area in particular? If so, you might want to consider opening a pop-up shop to test the market.
If the pop-up shop performs well, now you can consider opening a permanent retail location to continue gaining traction in that market.
Use these Shopify reports:
- View the Sales by billing location report to analyze your online sales data, know where customers are located, and spot if they’re congregated in certain cities or neighborhoods.
- Use the Sessions by location report to see what countries, regions, and cities your website visitors come from, and to spot trends.
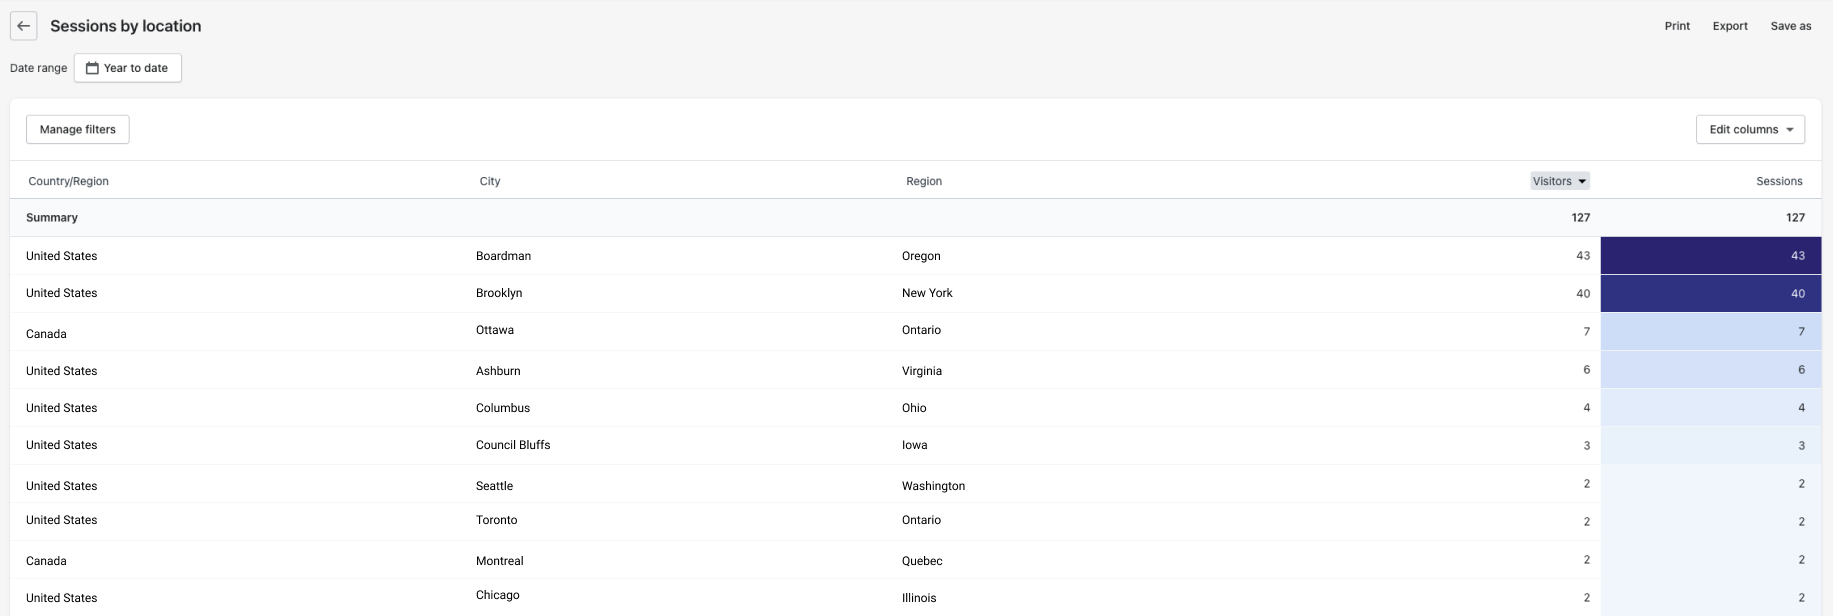
Compare data from Shopify’s Sales by billing location report with your Sessions by location to spot opportunities to open retail stores in other countries, cities, and regions.
4. Manage inventory online, in-store, and in your warehouse
Inventory is critical but expensive. In fact, cost of goods sold is often a merchant’s largest operating expense.
For merchants selling online and in retail stores, buying enough inventory without overstocking and running the risk of dead stock is one of their biggest ongoing challenges. US retailers are sitting on about $1.50 in inventory for every dollar of sales they make. That’s why knowing how much inventory you have in your warehouse and at each of your retail stores is so important.

Merchants using separate systems to manage their online and physical stores often run into inventory discrepancies because, as they make sales via their website or store, inventory levels don’t update in real-time. In the case of elph ceramics, it needed to re-count inventory each day and manually adjust the available quantities shoppers saw online to reflect what was in its POS system.
But since using Shopify to unify its online and store data, elph ceramics’ inventory adjusts in real-time as products are sold, returned, or exchanged.
The amount of times I count inventory is close to never. I still do them, but before I had to count stock at the end of each day to know how much we sold, reconcile inventory, and update stock quantities customers saw on our website. With Shopify POS, our stock levels sync automatically.
Rather than manually managing inventory for each of its sales channels each day, elph ceramics can confidently reorder products it’s running low on and avoid overstocking and spending precious capital on unnecessary inventory.
Use these Shopify reports to manage inventory more effectively
- Use the ABC data analysis technique to grade and categorize the products you sell based on the percentage of store revenue they’re responsible for. A-grade products account for around 80% of your revenue, B-grade account for 15% of revenue, and C-grade products account for only 5% of your revenue.
- View the Low stock report to see which products and variants you’re running low on, create purchase orders, and avoid stockouts.
- Use the Stock on hand report to see the cost and retail value of inventory you have in your warehouse and retail stores. You can filter the data by date range or to view inventory on hand from a specific vendor.
💡 PRO TIP: Set reorder points in Shopify Admin to get low stock notifications and ensure you have enough lead time to replenish inventory of a product before quantities reach zero.
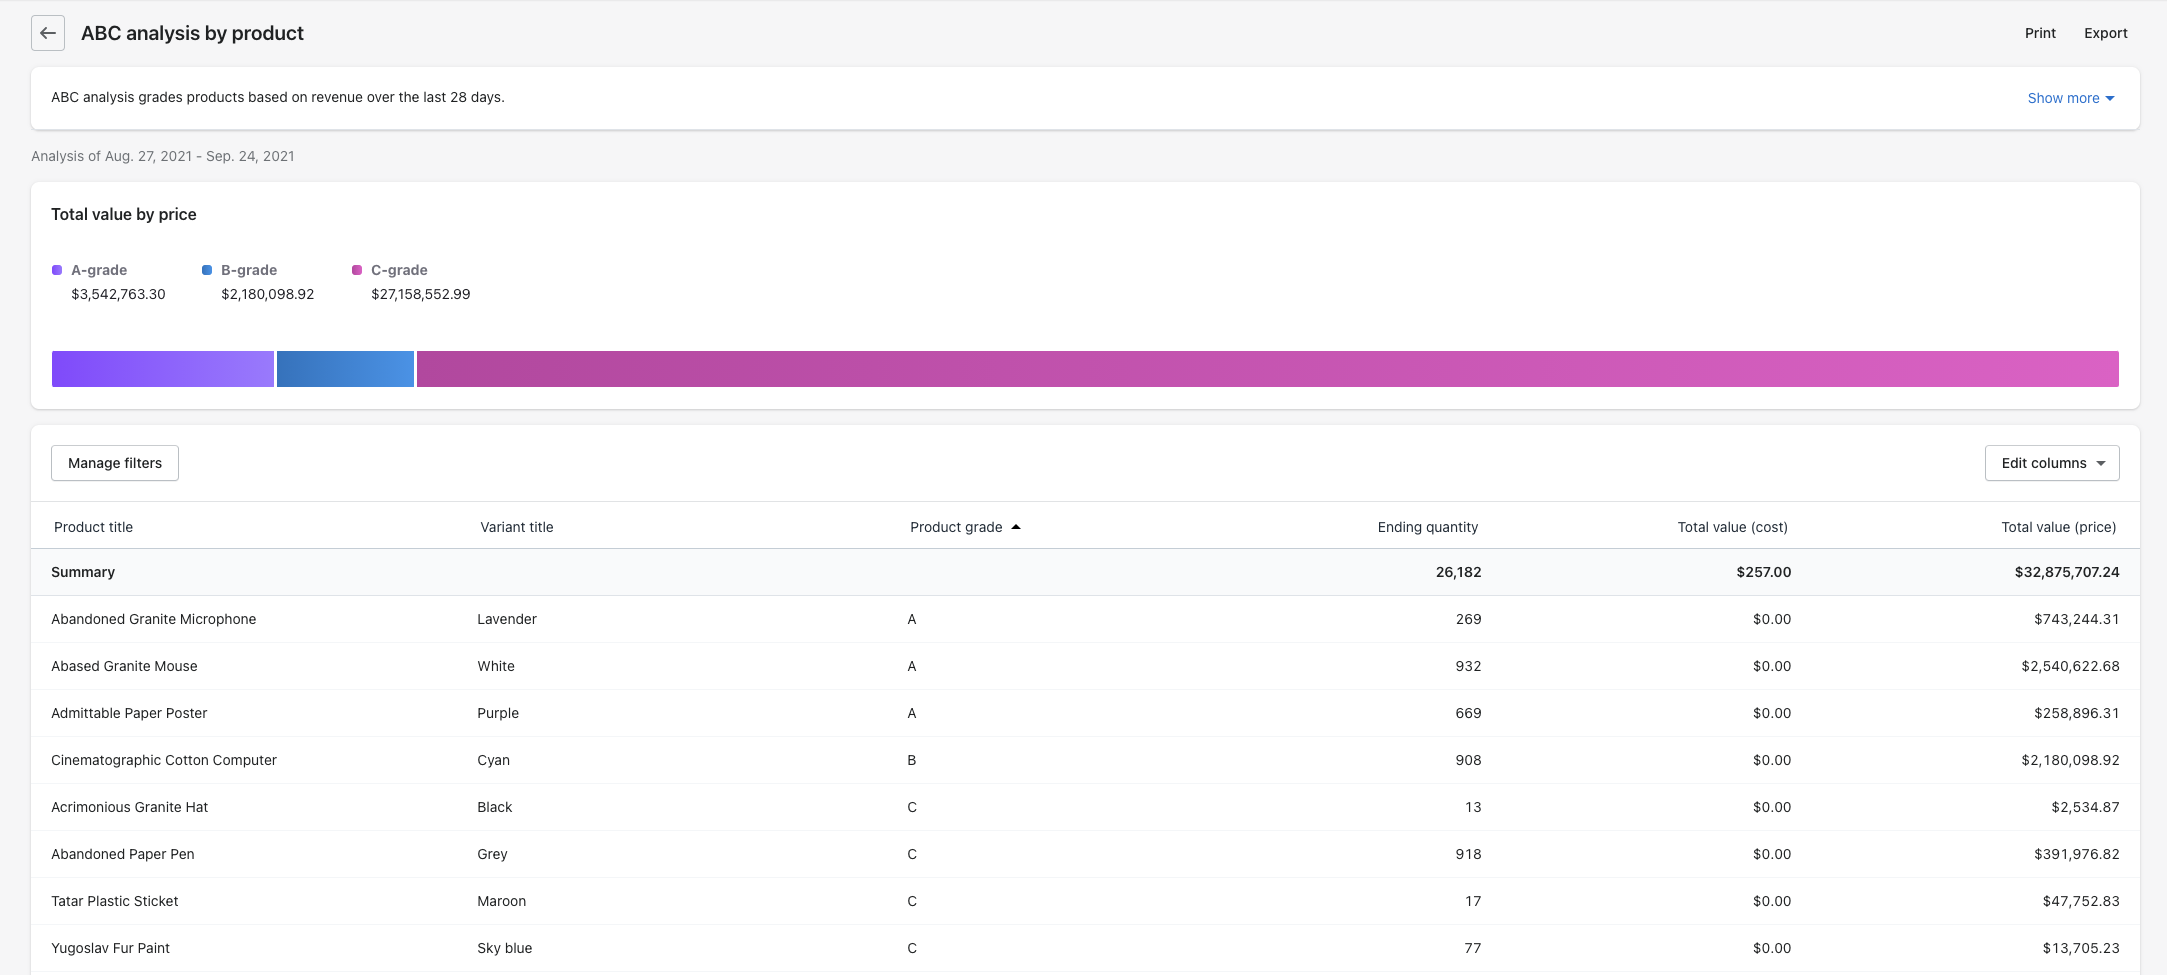
Shopify’s ABC Analysis by product report grades products based on the revenue they generate over the past 28 days
Pair POS and ecommerce data to run your business more effectively
POS data alone gives you insights into critical store information surrounding your sales, products, inventory, customers, and staff. But the key to understanding how your retail store contributes to your brand’s overall performance is to use POS data in tandem with your ecommerce data.
Pair both data sets together to unlock unique insights into how your physical touchpoints impact customer loyalty, how much they spend online and in-store, how long they stay customers for, and even when (and where) you could open another store to reach even more customers and continue your growth.
Read more
- The Complete Guide to Point-of-Sale (POS) Features
- 18 Essential Retail Reports to Evaluate Store Performance
- How to Track Store Performance: A Retailer’s Guide
- Personalization in Retail: How to Make the In-Store Experience Unique
- Revenue Per Employee: How to Calculate and Improve Your RPE Ratio
- How To Count and Leverage Footfall To Increase Sales
- The Retail Guide to Utilizing Sales Per Square Foot to Grow Your Store
